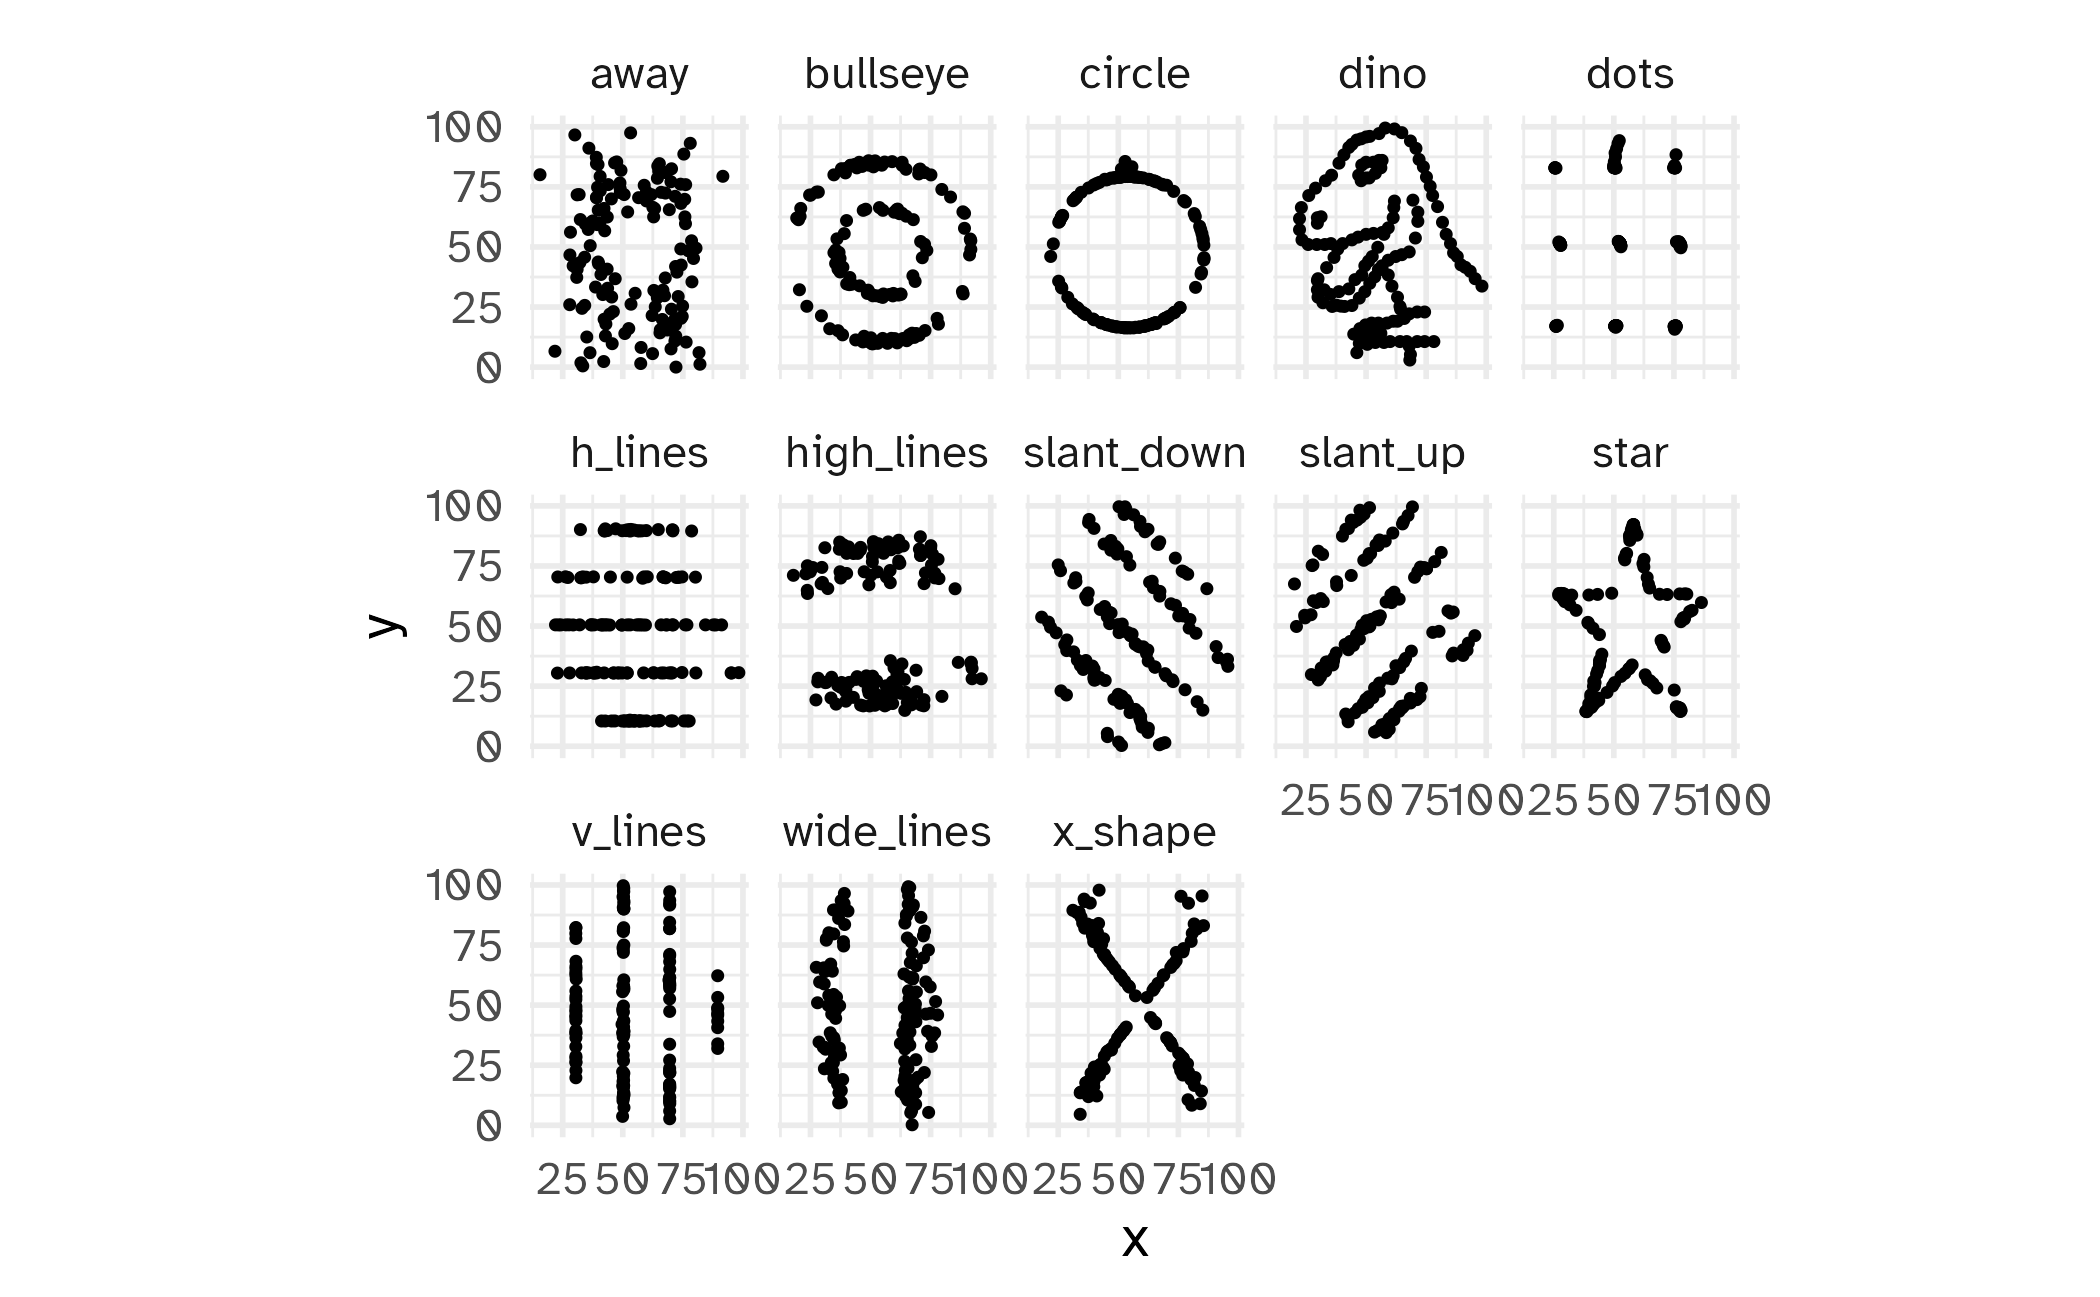
The grammar of graphics

Lecture 2

Dr. Benjamin Soltoff

Cornell University
INFO 5001 - Fall 2025

August 28, 2025

Announcements

Announcements

  • Enroll if you are not already enrolled
  • Homework 0 tomorrow

Learning objectives

  • Identify the importance of graphics in communicating information
  • Define the layered grammar of graphics
  • Practice generating statistical graphs using the grammar of graphics and {ggplot2}
  • Familiarize yourself with the Positron IDE

Warm up

Examining data visualization

Discuss the following for the visualization.

  • What is the visualization trying to show?

  • What is effective, i.e. what is done well?

  • What is ineffective, i.e. what could be improved?

  • What are you curious about after looking at the visualization?

03:00

Why visualize data?

Just show me the data!

ID N Xmean Ymean σX σY R
1 142 54.26610 47.83472 16.76982 26.93974 -0.06412835
2 142 54.26873 47.83082 16.76924 26.93573 -0.06858639
3 142 54.26732 47.83772 16.76001 26.93004 -0.06834336
4 142 54.26327 47.83225 16.76514 26.93540 -0.06447185
5 142 54.26030 47.83983 16.76774 26.93019 -0.06034144
6 142 54.26144 47.83025 16.76590 26.93988 -0.06171484
7 142 54.26881 47.83545 16.76670 26.94000 -0.06850422
8 142 54.26785 47.83590 16.76676 26.93610 -0.06897974
9 142 54.26588 47.83150 16.76885 26.93861 -0.06860921
10 142 54.26734 47.83955 16.76896 26.93027 -0.06296110
11 142 54.26993 47.83699 16.76996 26.93768 -0.06944557
12 142 54.26692 47.83160 16.77000 26.93790 -0.06657523
13 142 54.26015 47.83972 16.76996 26.93000 -0.06558334

Oh no

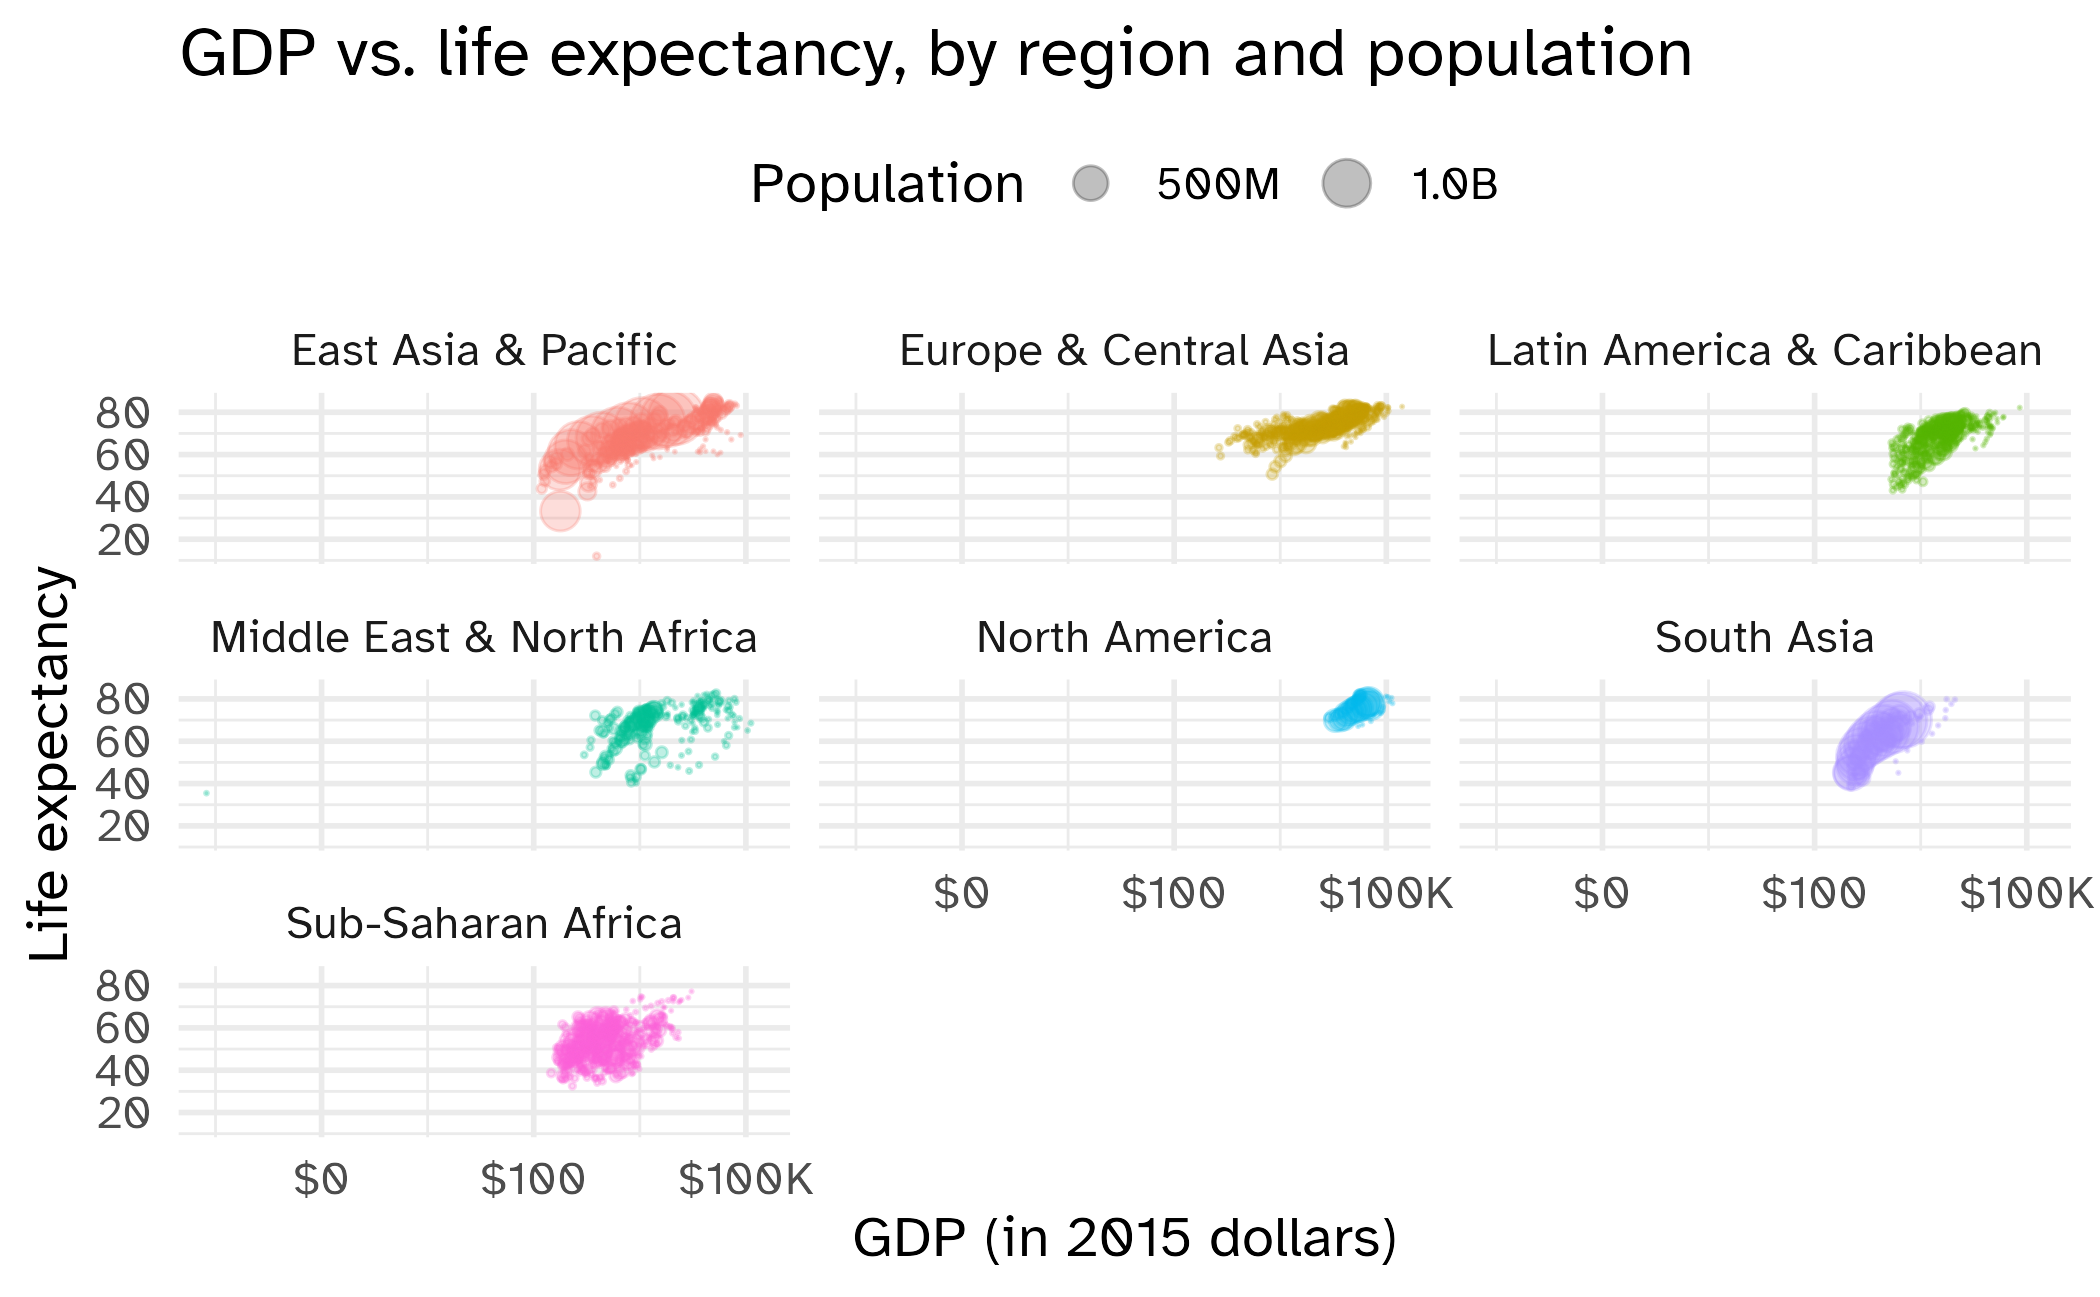
Raw data is not enough

The grammar of graphics

Grammar

The whole system and structure of a language or of languages in general, usually taken as consisting of syntax and morphology (including inflections) and sometimes also phonology and semantics.

Grammar of graphics

  • “The fundamental principles or rules of an art or science”
  • A grammar used to describe and create a wide range of statistical graphics
  • Layered grammar of graphics

A fuzzy monster in a beret and scarf, critiquing their own column graph on a canvas in front of them while other assistant monsters (also in berets) carry over boxes full of elements that can be used to customize a graph (like themes and geometric shapes). In the background is a wall with framed data visualizations. Stylized text reads 'ggplot2: build a data masterpiece.'

Application exercise

World development indicators

ae-00

Instructions

  • Go to github.com/info-5001/ae-00-wdi.
  • Clone the repo in Positron, run renv::restore() to install the required packages, open the Quarto document in the repo, and follow along and complete the exercises.

Warning

ae-00-wdi is hosted on GitHub.com because we have not configured your authentication method for Cornell’s GitHub. We will do this tomorrow in lab.

Wrap up

Recap

  • Construct plots with ggplot().
  • Components of ggplots are separated by +s.
  • The formula is (almost) always as follows:
ggplot(DATA, aes(x = X - VAR, y = Y - VAR, ...)) +
  geom_XXX()
  • Aesthetic attributes of a geometries (color, size, transparency, etc.) can be mapped to variables in the data or set by the user, e.g. color = region vs. color = "pink".
  • Use facet_wrap() when faceting (creating small multiples) by one variable and facet_grid() when faceting by two variables.