Working with relational data
Lecture 5
September 9, 2025

inner_join()
inner_join(x = superheroes, y = publishers, by = join_by(Publisher))

left_join()
left_join(x = superheroes, y = publishers, by = join_by(Publisher))

right_join()
right_join(x = superheroes, y = publishers, by = join_by(Publisher))

right_join() reversed
left_join(x = publishers, y = superheroes, by = join_by(Publisher))
full_join()
full_join(x = superheroes, y = publishers, by = join_by(Publisher))
semi_join()
semi_join(x = superheroes, y = publishers, by = join_by(Publisher))
anti_join()
anti_join(x = superheroes, y = publishers, by = join_by(Publisher))

Goal
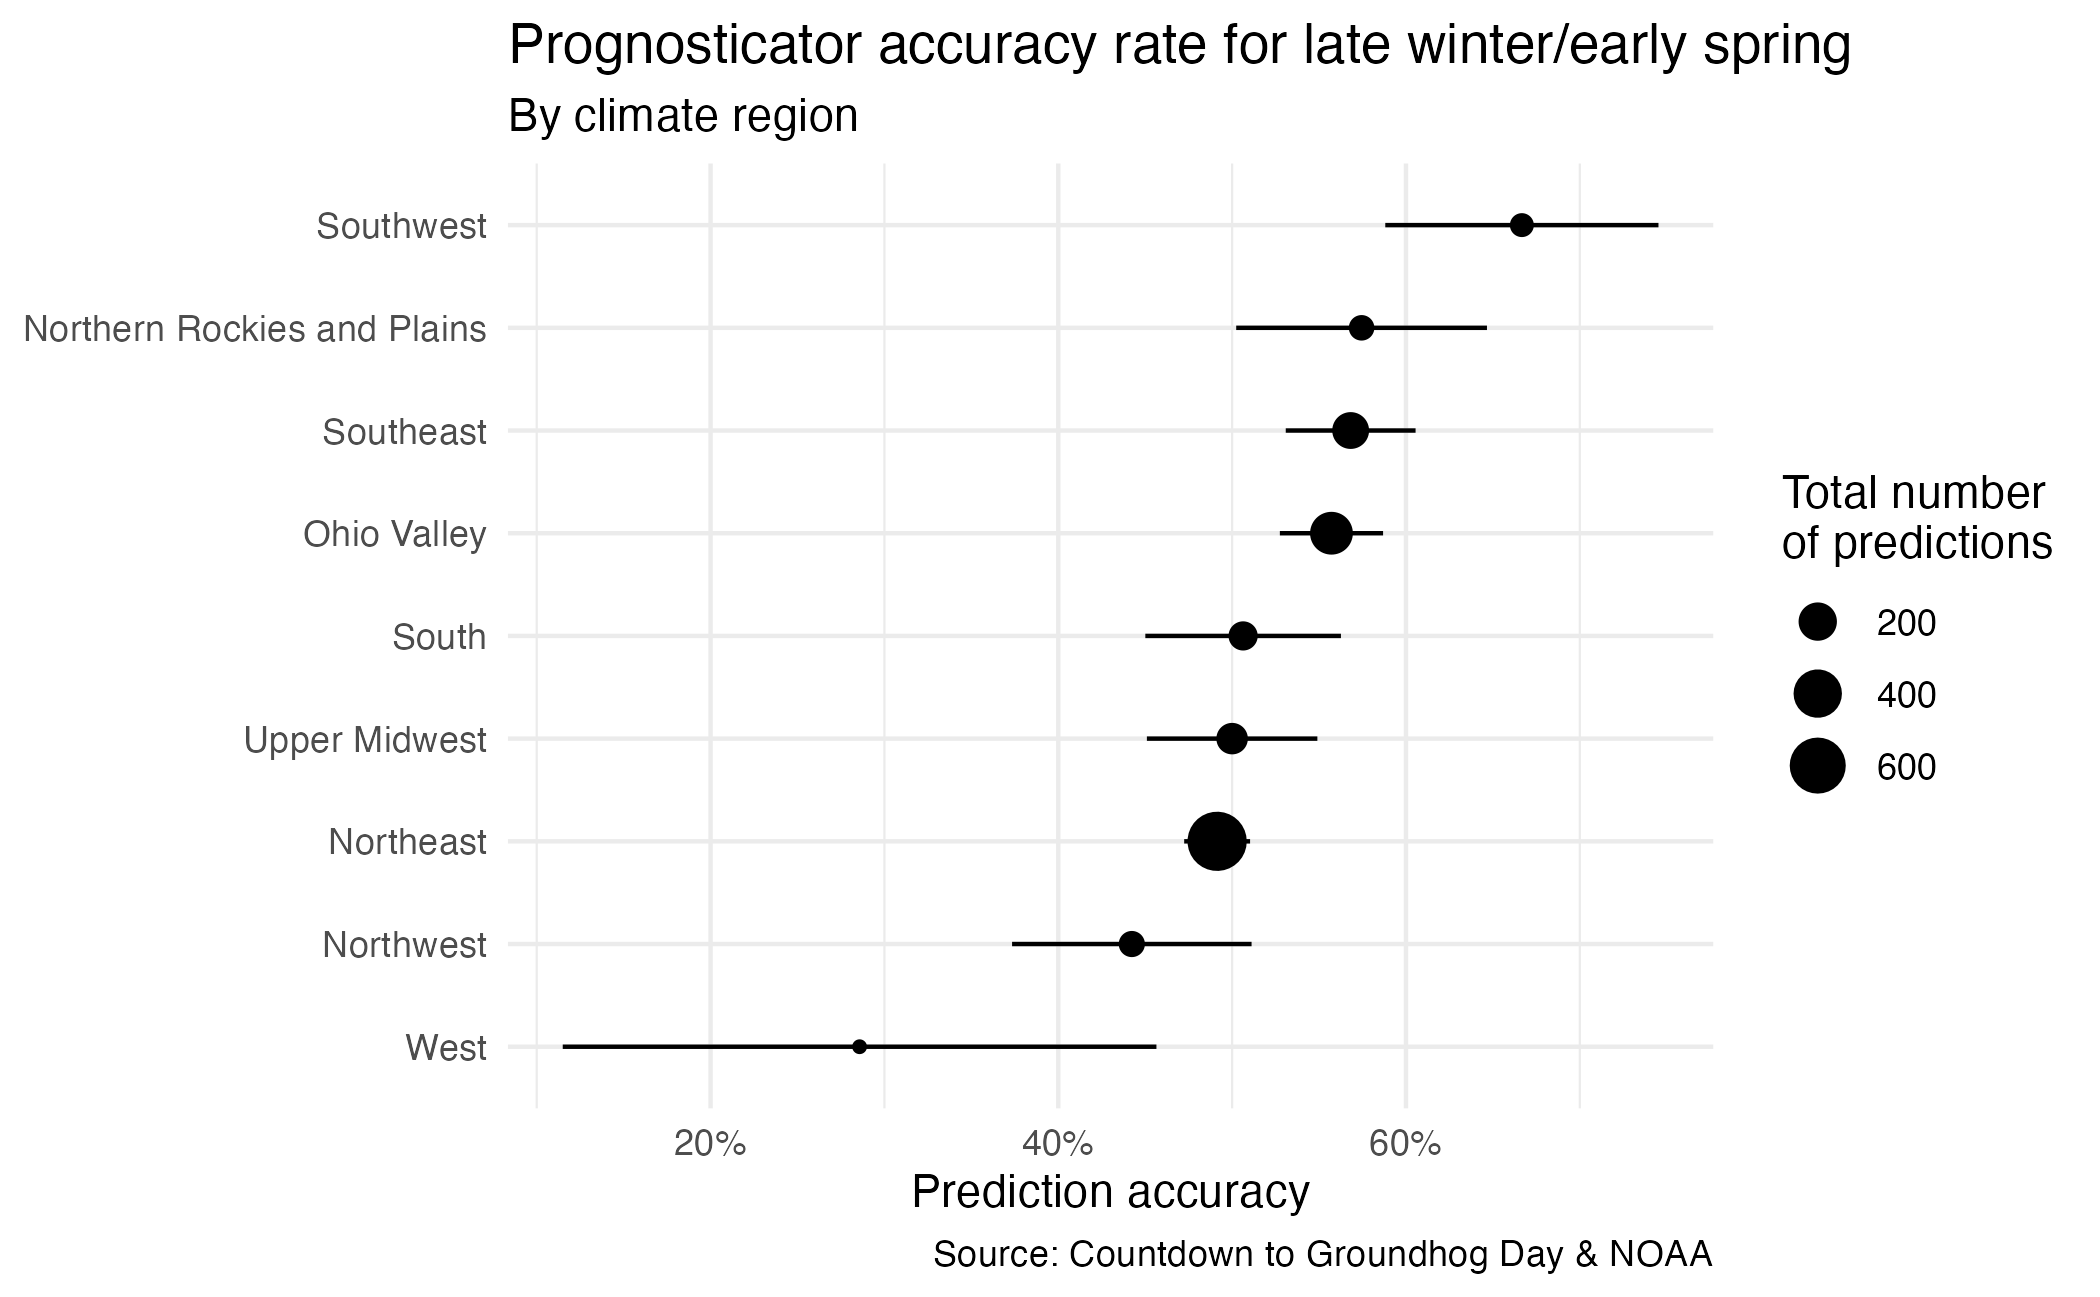
TidyTuesday
![]()