Rows: 344
Columns: 8
$ species           <fct> Adelie, Adelie, Adelie, Adelie, Adelie, Adelie, Adel…
$ island            <fct> Torgersen, Torgersen, Torgersen, Torgersen, Torgerse…
$ bill_length_mm    <dbl> 39.1, 39.5, 40.3, NA, 36.7, 39.3, 38.9, 39.2, 34.1, …
$ bill_depth_mm     <dbl> 18.7, 17.4, 18.0, NA, 19.3, 20.6, 17.8, 19.6, 18.1, …
$ flipper_length_mm <int> 181, 186, 195, NA, 193, 190, 181, 195, 193, 190, 186…
$ body_mass_g       <int> 3750, 3800, 3250, NA, 3450, 3650, 3625, 4675, 3475, …
$ sex               <fct> male, female, female, NA, female, male, female, male…
$ year <int> 2007, 2007, 2007, 2007, 2007, 2007, 2007, 2007, 2007…Recoding data + rowwise/columnwise operations
Lecture 10
Dr. Benjamin Soltoff
Cornell University
INFO 5001 - Fall 2023
2023-09-27
Meet the Palmer penguins
Meet the Palmer penguins

penguins
Rowwise operations
Motivation
What is the sum of bill length and bill depth?
penguins_s <- penguins |>
  select(species, bill_length_mm, bill_depth_mm)

penguins_s |>
  mutate(
    bill_sum = bill_depth_mm + bill_length_mm
  )
# A tibble: 344 × 4
species bill_length_mm bill_depth_mm bill_sum
<fct> <dbl> <dbl> <dbl>
1 Adelie 39.1 18.7 57.8
2 Adelie 39.5 17.4 56.9
3 Adelie 40.3 18 58.3
4 Adelie NA NA NA
5 Adelie 36.7 19.3 56
6 Adelie 39.3 20.6 59.9
7 Adelie 38.9 17.8 56.7
8 Adelie 39.2 19.6 58.8
9 Adelie 34.1 18.1 52.2
10 Adelie 42 20.2 62.2
# ℹ 334 more rowsWhat if we have more columns?
Use sum()
# A tibble: 344 × 4
   species bill_length_mm bill_depth_mm bill_sum
   <fct>            <dbl>         <dbl>    <dbl>
 1 Adelie            39.1          18.7       NA
 2 Adelie            39.5          17.4       NA
 3 Adelie            40.3          18         NA
 4 Adelie            NA            NA         NA
 5 Adelie            36.7          19.3       NA
 6 Adelie            39.3          20.6       NA
 7 Adelie            38.9          17.8       NA
 8 Adelie            39.2          19.6       NA
 9 Adelie            34.1          18.1       NA
10 Adelie            42            20.2       NA
# ℹ 334 more rows
What went wrong?
Rowwise operations
# A tibble: 344 × 4
# Rowwise:
   species bill_length_mm bill_depth_mm bill_sum
   <fct>            <dbl>         <dbl>    <dbl>
 1 Adelie            39.1          18.7     57.8
 2 Adelie            39.5          17.4     56.9
 3 Adelie            40.3          18       58.3
 4 Adelie            NA            NA       NA
 5 Adelie            36.7          19.3     56
 6 Adelie            39.3          20.6     59.9
 7 Adelie            38.9          17.8     56.7
 8 Adelie            39.2          19.6     58.8
 9 Adelie            34.1          18.1     52.2
10 Adelie            42            20.2     62.2
# ℹ 334 more rows
rowwise() is equivalent to group_by() every row
Selection helpers
penguins_s <- penguins |>
  select(
    species,
    starts_with("bill")
  )

penguins_s |>
  rowwise() |>
  mutate(
    bill_sum = sum(c_across(starts_with("bill")))
  )
# A tibble: 344 × 4
# Rowwise:
species bill_length_mm bill_depth_mm bill_sum
<fct> <dbl> <dbl> <dbl>
1 Adelie 39.1 18.7 57.8
2 Adelie 39.5 17.4 56.9
3 Adelie 40.3 18 58.3
4 Adelie NA NA NA
5 Adelie 36.7 19.3 56
6 Adelie 39.3 20.6 59.9
7 Adelie 38.9 17.8 56.7
8 Adelie 39.2 19.6 58.8
9 Adelie 34.1 18.1 52.2
10 Adelie 42 20.2 62.2
# ℹ 334 more rowsSelection helpers
starts_with(): Starts with a prefixends_with(): Ends with a suffixcontains(): Contains a literal stringnum_range(): Matches a numerical range like x01, x02, x03one_of(): Matches variable names in a character vectoreverything(): Matches all variableslast_col(): Select last variable, possibly with an offsetmatches(): Matches a regular expression (a sequence of symbols/characters expressing a string/pattern to be searched for within text)
c_across(): Use a tidy selector within a non-selecting function (e.g.sum())
Working with multiple columns
Summarizing columns individually
Summarizing columns iteratively
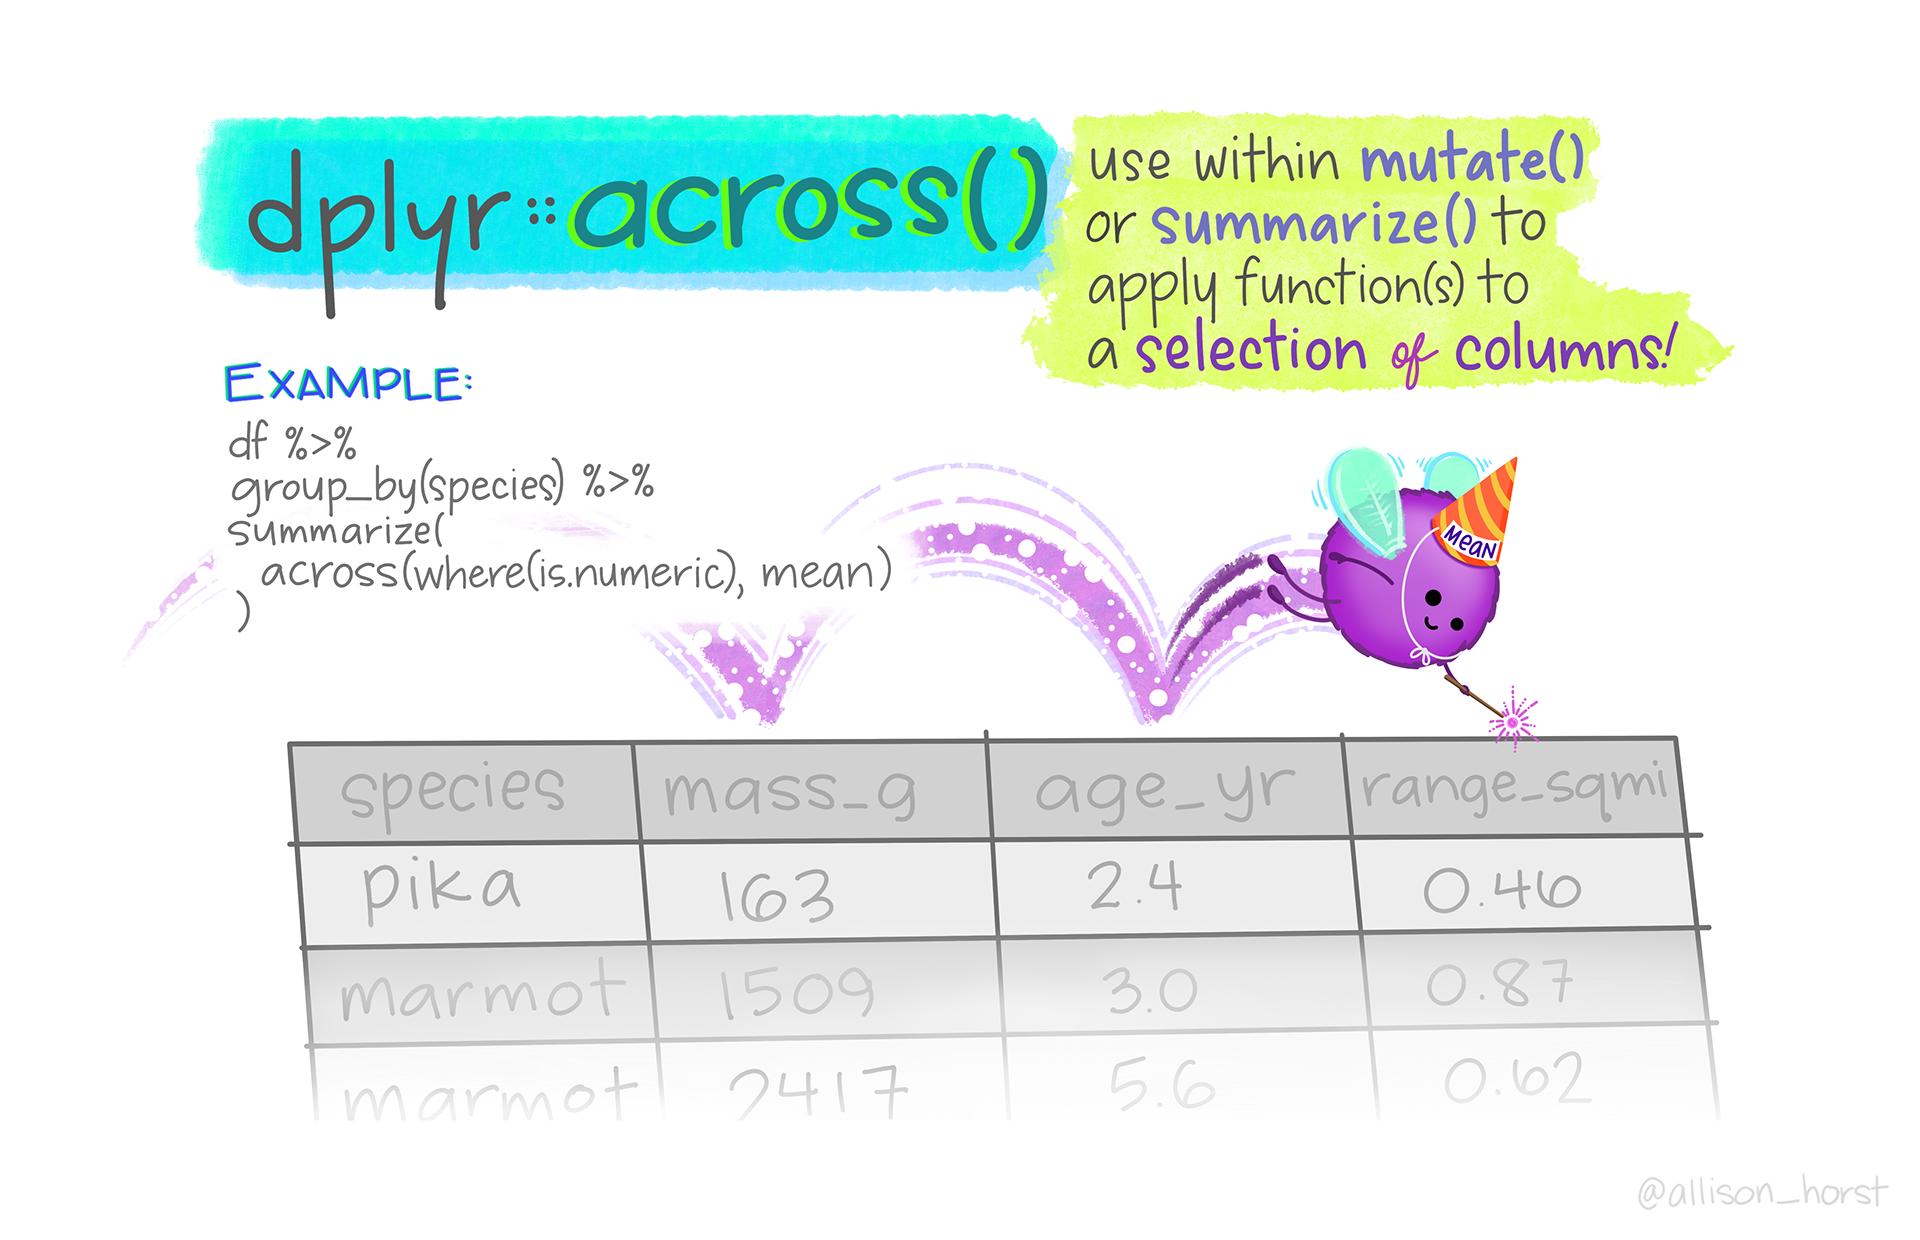
across() + selector helpers
# A tibble: 1 × 8
  species island bill_length_mm bill_depth_mm flipper_length_mm body_mass_g
    <int>  <int>          <int>         <int>             <int>       <int>
1       3      3            165            81                56          95
# ℹ 2 more variables: sex <int>, year <int>Implementing anonymous functions
- In-line functions
- Lambda functions
Count number of missing values per column
Multiple summarize operations
penguins |>
  drop_na() |>
  summarize(
    across(
      .cols = where(is.numeric),
      .fns = list(mean = mean, sd = sd),
      .names = "{.fn}_{.col}"
    )
  )
# A tibble: 1 × 10
mean_bill_length_mm sd_bill_length_mm mean_bill_depth_mm sd_bill_depth_mm
<dbl> <dbl> <dbl> <dbl>
1 44.0 5.47 17.2 1.97
# ℹ 6 more variables: mean_flipper_length_mm <dbl>, sd_flipper_length_mm <dbl>,
# mean_body_mass_g <dbl>, sd_body_mass_g <dbl>, mean_year <dbl>,
# sd_year <dbl>Bring back anonymous functions
penguins |>
  summarize(
    across(
      .cols = where(is.numeric),
      .fns = list(
        mean = \(x) mean(x, na.rm = TRUE),
        sd = \(x) sd(x, na.rm = TRUE)
      ),
      .names = "{.fn}_{.col}"
    )
  )
# A tibble: 1 × 10
mean_bill_length_mm sd_bill_length_mm mean_bill_depth_mm sd_bill_depth_mm
<dbl> <dbl> <dbl> <dbl>
1 43.9 5.46 17.2 1.97
# ℹ 6 more variables: mean_flipper_length_mm <dbl>, sd_flipper_length_mm <dbl>,
# mean_body_mass_g <dbl>, sd_body_mass_g <dbl>, mean_year <dbl>,
# sd_year <dbl>Do it within groups
penguins |>
  group_by(species) |>
  summarize(
    across(
      .cols = where(is.numeric),
      .fns = list(
        mean = \(x) mean(x, na.rm = TRUE),
        sd = \(x) sd(x, na.rm = TRUE)
      ),
      .names = "{.fn}_{.col}"
    )
  )
# A tibble: 3 × 11
species mean_bill_length_mm sd_bill_length_mm mean_bill_depth_mm
<fct> <dbl> <dbl> <dbl>
1 Adelie 38.8 2.66 18.3
2 Chinstrap 48.8 3.34 18.4
3 Gentoo 47.5 3.08 15.0
# ℹ 7 more variables: sd_bill_depth_mm <dbl>, mean_flipper_length_mm <dbl>,
# sd_flipper_length_mm <dbl>, mean_body_mass_g <dbl>, sd_body_mass_g <dbl>,
# mean_year <dbl>, sd_year <dbl>Modify columns
# A tibble: 344 × 8
   species island    bill_length_mm[,1] bill_depth_mm[,1] flipper_length_mm[,1]
   <fct>   <fct>                  <dbl>             <dbl>                 <dbl>
 1 Adelie  Torgersen             -0.883             0.784                -1.42
 2 Adelie  Torgersen             -0.810             0.126                -1.06
 3 Adelie  Torgersen             -0.663             0.430                -0.421
 4 Adelie  Torgersen             NA                NA                    NA
 5 Adelie  Torgersen             -1.32              1.09                 -0.563
 6 Adelie  Torgersen             -0.847             1.75                 -0.776
 7 Adelie  Torgersen             -0.920             0.329                -1.42
 8 Adelie  Torgersen             -0.865             1.24                 -0.421
 9 Adelie  Torgersen             -1.80              0.480                -0.563
10 Adelie  Torgersen             -0.352             1.54                 -0.776
# ℹ 334 more rows
# ℹ 3 more variables: body_mass_g <int>, sex <fct>, year <int>
Rename output columns
penguins |>
  mutate(across(
    .cols = ends_with("mm"),
    .fns = scale,
    .names = "{.col}_sc"
  )) |>
  select(contains("mm"))
# A tibble: 344 × 6
bill_length_mm bill_depth_mm flipper_length_mm bill_length_mm_sc[,1]
<dbl> <dbl> <int> <dbl>
1 39.1 18.7 181 -0.883
2 39.5 17.4 186 -0.810
3 40.3 18 195 -0.663
4 NA NA NA NA
5 36.7 19.3 193 -1.32
6 39.3 20.6 190 -0.847
7 38.9 17.8 181 -0.920
8 39.2 19.6 195 -0.865
9 34.1 18.1 193 -1.80
10 42 20.2 190 -0.352
# ℹ 334 more rows
# ℹ 2 more variables: bill_depth_mm_sc <dbl[,1]>,
# flipper_length_mm_sc <dbl[,1]>across() not always needed
# A tibble: 344 × 5
   bill_length_mm bill_depth_mm flipper_length_mm body_mass_g  year
            <dbl>         <dbl>             <int>       <int> <int>
 1           39.1          18.7               181        3750  2007
 2           39.5          17.4               186        3800  2007
 3           40.3          18                 195        3250  2007
 4           NA            NA                  NA          NA  2007
 5           36.7          19.3               193        3450  2007
 6           39.3          20.6               190        3650  2007
 7           38.9          17.8               181        3625  2007
 8           39.2          19.6               195        4675  2007
 9           34.1          18.1               193        3475  2007
10           42            20.2               190        4250  2007
# ℹ 334 more rowsApplication exercise
ae-08
- Go to the course GitHub org and find your
ae-08(repo name will be suffixed with your GitHub name). - Clone the repo in RStudio Workbench, open the Quarto document in the repo, and follow along and complete the exercises.
- Render, commit, and push your edits by the AE deadline – end of tomorrow
Recap
- Use
rowwise()to perform calculations within rows of data frames - Column-wise operations can be performed using
across() - Make use of lambda/anonymous functions to perform custom operations on-the-fly
Apple Harvest Festival