ui <- page_sidebar(
title = "LEGO Explorer",
sidebar = qc$sidebar(), # chat lives in the sidebar
... # your cards, plots, value boxes
)
server <- function(input, output, session) {
qc_vals <- qc$server()
sets_tbl <- qc_vals$table("sets")
sets_tbl$df() # filtered data frame (reactive)
sets_tbl$sql() # the SQL behind it (reactive)
sets_tbl$title() # the LLM's short label for it (reactive)
}Natural language interfaces to data with {querychat}
Lecture 24
Dr. Benjamin Soltoff
Cornell University
INFO 5001 - Fall 2026
November 19, 2026
Announcements
Announcements
- Project draft due tonight
- Discussion section tomorrow
Learning objectives
- Create natural language interfaces to data with {querychat}
- Define the workflow of a {querychat} app and what information is passed back and forth to the LLM
- Combine {querychat} with pre-coded Shiny outputs to build a dashboard
Application exercise
ae-22
Instructions
- Go to the course GitHub org and find your
ae-22(repo name will be suffixed with your GitHub name). - Clone the repo in Positron, run
renv::restore()to install the required packages, open the Quarto document in the repo, and follow along and complete the exercises. - Render, commit, and push your edits by the AE deadline – end of the day
🔓 Decrypt the .Renviron.secret → .Renviron
source("secret.R")- The special phrase is:
info-5001
querychat
Remember the LEGO Explorer?
Today: how it works, what it sends to the LLM, and how to build a real dashboard around it.
A standard Shiny app

A {querychat} app

Why {querychat}?
- The data has too many columns to build a filter for each one
- Users want combinations of filters you didn’t anticipate
- Several related tables that users want to join
- Users who don’t write SQL or R
{querychat} in R
library(querychat)

lego <- DBI::dbConnect(
  duckdb::duckdb(),
  dbdir = "data/lego.duckdb",
  read_only = TRUE
)

qc <- QueryChat$new(
  data_source = lego,
  table_name = "sets",
  client = "anthropic/claude-sonnet-5",
  history = FALSE
)

# register the other tables so the LLM can join across them
qc$add_tables(lego, tables = setdiff(DBI::dbListTables(lego), "sets"))

qc$app()⌨️ Your turn - 01_querychat-app
Instructions
Run _exercises/01_querychat-app.R. Ask one question of each kind:
- Filter: “Show only Technic sets released since 2020”
- Summarize: “Which year had the most sets released?”
- Visualize: “Plot the number of sets released per year”
Open the tool card under each answer. Which tool was called? What SQL did it write?
06:00
How {querychat} works
Tool calling
Recall: the LLM can’t run code. It asks your computer to call a tool, and your computer sends back the result.
{querychat} is a Shiny app with a set of SQL tools.
querychat’s tools
Tool (querychat_*) |
Used for | Sent back to the LLM |
|---|---|---|
get_schema |
Learning a table’s structure | Column names, types, ranges, low-cardinality values |
update_dashboard |
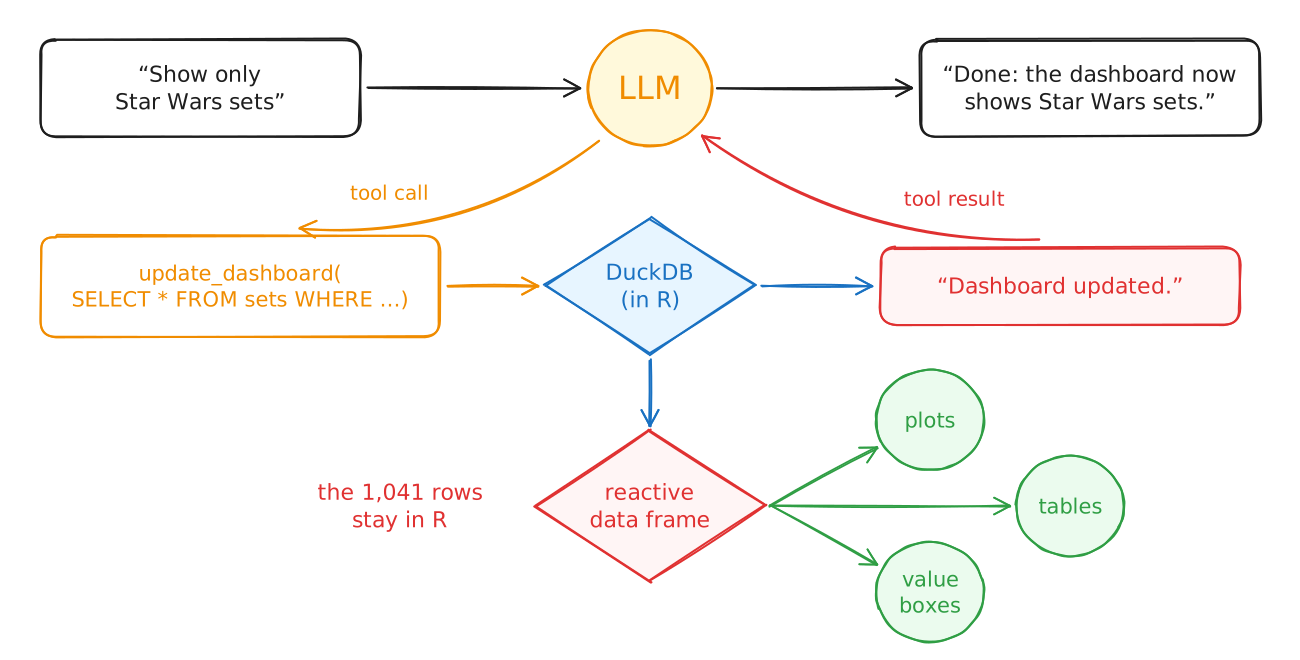
“Show me…”, “Filter to…” | Only “Dashboard updated.” |
reset_dashboard |
“Start over” | A confirmation |
query |
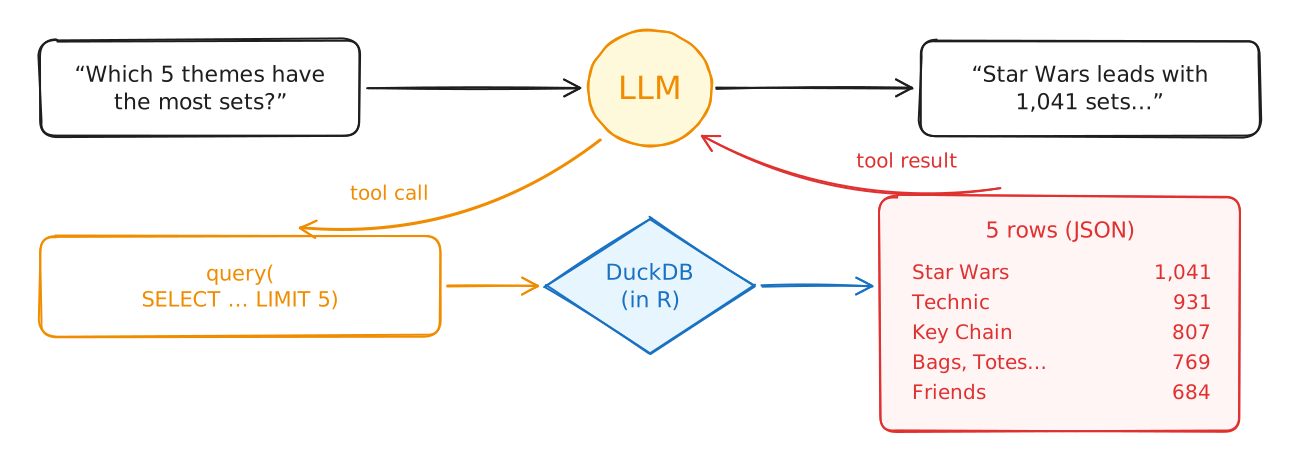
“How many…?”, “Average…?” | The result rows |
visualize |
“Plot…” | A PNG image of the chart |
A summary request
A filter request
So does the LLM see my data?
- It never gets the whole table, and it never does the math itself – all computations are local
- But it does see:
- Column names, types, and ranges (schema tool)
- Every value of low-cardinality text columns
- Anything in your data dictionary, including example values
- The rows returned by every summary query
- A picture of every chart
- Only
update_dashboardkeeps results entirely on your computer tools = "filter"keeps only the dashboard tools, so no query result ever leaves
What’s in the system prompt?
- What the LLM is (a dashboard chatbot) and which tables exist
- SQL rules for DuckDB: one
SELECT, no semicolons, quoting rules - When to use each tool
- A full ggsql syntax reference for charts
- Your data description, data dictionary, and extra instructions
Building a dashboard with {querychat}
Beyond the chat app
qc$app() is a quick way to explore. But {querychat} is also a reactive data source for your own app.
Reactive graph
The chat is just another reactive source. Everything downstream is the Shiny you already know.
Demo 01 - LEGO dashboard
💾 _demos/01_lego-dashboard.R
# LEGO Explorer: a querychat dashboard
#
# The chat (left) writes SQL. Everything else on the page is ordinary Shiny
# code that reacts to querychat's reactive values for the `sets` table:
#
#   sets_tbl$df()     filtered sets   -> sets() -> value boxes, plots, table
#   sets_tbl$sql()    current SQL     -> "Current query" card
#   sets_tbl$title()  LLM's label     -> card headers
#   input$group       a traditional input -> theme plot only

library(tidyverse)
library(shiny)
library(bslib)
library(bsicons)
library(reactable)
library(querychat)

# data ---------------------------------------------------------------------

lego <- DBI::dbConnect(
  duckdb::duckdb(),
  dbdir = here::here("data/lego.duckdb"),
  read_only = TRUE
)
onStop(function() DBI::dbDisconnect(lego, shutdown = TRUE))

# themes nest up to three levels deep; find each theme's top-level ancestor
themes <- tbl(lego, "themes") |>
  collect()

theme_lookup <- themes |>
  select(theme_id = id, theme = name, parent_id) |>
  left_join(
    themes |> select(id, parent_name = name, grandparent_id = parent_id),
    by = join_by(parent_id == id)
  ) |>
  left_join(
    themes |> select(id, grandparent_name = name),
    by = join_by(grandparent_id == id)
  ) |>
  mutate(top_theme = coalesce(grandparent_name, parent_name, theme)) |>
  select(theme_id, theme, top_theme)

# querychat ----------------------------------------------------------------

qc <- QueryChat$new(
  data_source = lego,
  table_name = "sets",
  client = "anthropic/claude-sonnet-5",
  data_dict = here::here("data/data-dict.yaml"),
  greeting = here::here("data/greeting.md"),
  extra_instructions = paste(
    "The dashboard displays the `sets` table.",
    "When the user asks to show, filter, or sort sets (including by theme,",
    "minifigure, part, or color), call the dashboard update tool on the",
    "`sets` table, using subqueries on the other tables where needed."
  ),
  # start each class demo with a fresh conversation
  history = FALSE
)

# register the remaining tables so the LLM can join across them
qc$add_tables(
  lego,
  tables = c(
    "themes",
    "minifigs",
    "inventories",
    "inventory_sets",
    "inventory_minifigs",
    "inventory_parts",
    "parts",
    "part_categories",
    "colors"
  )
)

# ui -----------------------------------------------------------------------

ui <- page_sidebar(
  title = "LEGO Explorer",
  fillable = FALSE,
  sidebar = qc$sidebar(),
  layout_columns(
    fill = FALSE,
    value_box(
      title = "Sets",
      value = textOutput("n_sets"),
      showcase = bs_icon("box-seam"),
      theme = "primary"
    ),
    value_box(
      title = "Themes",
      value = textOutput("n_themes"),
      showcase = bs_icon("tags"),
      theme = "secondary"
    ),
    value_box(
      title = "Release years",
      value = textOutput("years"),
      showcase = bs_icon("calendar3"),
      theme = "info"
    ),
    value_box(
      title = "Median pieces per set",
      value = textOutput("median_parts"),
      showcase = bs_icon("bricks"),
      theme = "success"
    )
  ),
  layout_columns(
    col_widths = c(6, 6),
    card(
      full_screen = TRUE,
      card_header(textOutput("year_title")),
      plotOutput("year_plot")
    ),
    card(
      full_screen = TRUE,
      card_header(
        "Most common themes",
        # a traditional Shiny input living alongside the chat
        popover(
          bs_icon("gear", title = "Settings"),
          radioButtons(
            inputId = "group",
            label = "Group sets by",
            choices = c(
              "Top-level theme" = "top_theme",
              "Theme" = "theme"
            )
          )
        ),
        class = "d-flex justify-content-between align-items-center"
      ),
      plotOutput("theme_plot")
    )
  ),
  card(
    full_screen = TRUE,
    card_header(textOutput("table_title")),
    reactableOutput("sets_table")
  ),
  card(
    card_header("Current query"),
    verbatimTextOutput("sql")
  )
)

# server -------------------------------------------------------------------

server <- function(input, output, session) {
  qc_vals <- qc$server()

  # reactive sources provided by querychat for the `sets` table
  sets_tbl <- qc_vals$table("sets")

  # reactive conductor: the filtered sets, with theme names attached
  sets <- reactive({
    sets_tbl$df() |>
      as_tibble() |>
      left_join(theme_lookup, by = join_by(theme_id))
  })

  # the LLM's description of the current filter, if any
  filter_label <- reactive({
    sets_tbl$title() %||% "All sets"
  })

  # value boxes --------------------------------------------------------------

  output$n_sets <- renderText({
    nrow(sets()) |> scales::label_comma()()
  })

  output$n_themes <- renderText({
    n_distinct(sets()$theme_id) |> scales::label_comma()()
  })

  output$years <- renderText({
    req(nrow(sets()) > 0)
    yrs <- range(sets()$year)
    if (yrs[1] == yrs[2]) yrs[1] else str_c(yrs[1], "–", yrs[2])
  })

  output$median_parts <- renderText({
    # sets with 0 parts are bundles or have no inventory; leave them out
    parts <- sets()$num_parts[sets()$num_parts > 0]
    req(length(parts) > 0)
    median(parts) |> scales::label_comma()()
  })

  # plots --------------------------------------------------------------------

  output$year_title <- renderText({
    str_c("Sets released per year: ", filter_label())
  })

  output$year_plot <- renderPlot({
    req(nrow(sets()) > 0)

    sets() |>
      count(year) |>
      ggplot(mapping = aes(x = year, y = n)) +
      geom_col(fill = "#B31B1B") +
      labs(x = NULL, y = "Number of sets") +
      theme_minimal(base_size = 14)
  })

  output$theme_plot <- renderPlot({
    req(nrow(sets()) > 0)

    sets() |>
      count(group = .data[[input$group]], sort = TRUE) |>
      slice_head(n = 10) |>
      ggplot(mapping = aes(x = n, y = fct_reorder(group, n))) +
      geom_col(fill = "#B31B1B") +
      labs(x = "Number of sets", y = NULL) +
      theme_minimal(base_size = 14)
  })

  # table --------------------------------------------------------------------

  output$table_title <- renderText({
    filter_label()
  })

  output$sets_table <- renderReactable({
    sets() |>
      arrange(desc(year), set_num) |>
      select(img_url, set_num, name, year, theme, top_theme, num_parts) |>
      reactable(
        searchable = TRUE,
        defaultPageSize = 8,
        columns = list(
          img_url = colDef(
            name = "",
            width = 90,
            sortable = FALSE,
            cell = function(value) {
              img(src = value, height = "60px", alt = "")
            }
          ),
          set_num = colDef(name = "Set"),
          name = colDef(name = "Name", minWidth = 200),
          year = colDef(name = "Year"),
          theme = colDef(name = "Theme"),
          top_theme = colDef(name = "Top-level theme"),
          num_parts = colDef(
            name = "Pieces",
            format = colFormat(separators = TRUE)
          )
        )
      )
  })

  # SQL ----------------------------------------------------------------------

  # the query the LLM wrote, shown for transparency
  # (ask the chat to "reset" to return to all sets)
  output$sql <- renderText({
    sets_tbl$sql() %||% "SELECT * FROM sets"
  })
}

shinyApp(ui = ui, server = server)
Giving the LLM context
Context options
| Argument | What it is | Use it for |
|---|---|---|
data_dict |
YAML file describing tables, columns, relationships, glossary | Multiple tables; domain rules (recommended) |
data_description |
Free-form text or markdown | One simple table |
extra_instructions |
Text appended to the system prompt | Behavior: “the dashboard shows sets” |
greeting |
Markdown shown when the chat opens | Suggested questions; avoids an LLM call per visitor |
client |
"provider/model" or an {ellmer} Chat |
Choosing the model |
The LEGO data dictionary
Demo 02 - Does context change the answer?
“What was the average number of pieces per set in 2022?”
  all_sets sets_with_parts
1    231.3             395
💾 _demos/02_context.R
Building with Posit Assistant
⌨️ Your turn - 02_extend-dashboard
Instructions
_exercises/02_extend-dashboard.R is the LEGO dashboard. Ask Posit Assistant to add a card showing the 10 most common brick colors in the currently filtered sets, with each bar filled in its actual color.
Then audit it:
- Add the new output to the reactive graph. What does it depend on?
- Ask the chat to filter (e.g. “Show only Technic sets”). Does the new card update?
- Where does the color count come from: R or SQL? How many rows does it move into R?
- Try to break it: one adversarial or off-topic prompt in the chat.
15:00
Discussion
- How did your assistant get the filtered sets into the color query?
- Did anyone’s version pull all 1.4 million
inventory_partsrows into R? - What happened with your adversarial prompt?
Deploying a Shiny app
Deploy to Posit Connect Cloud
From Positron, with the built-in Posit Publisher:
- Put the app in its own folder:
app.Rplus its data files - Open the Posit Publisher icon in the Activity Bar
- Under Credentials, add a Posit Connect Cloud credential and authorize it in the browser (once)
- Click + next to Deployments and choose
app.R - Check Project Files: only listed files are uploaded
- Deploy Your Project
API keys are secrets
- Never put an API key in
app.Ror commit it - Add it as a secret variable in the deployment (e.g.
ANTHROPIC_API_KEY) - {ellmer} reads it from the environment, the same as on your computer
- Anyone who can open the app spends tokens on your key – watch usage
Additional resources
Mastering Shiny
Learn more
- {querychat} for R: build guide, context, tools, visualizations
- {shinychat}: chat UI components for your own LLM apps
- Shiny user showcase
- {bslib}: layouts, components, and theming
- {shinyreact}: React UI infrastructure for Shiny
Wrap-up
Recap
- {querychat} turns natural language into SQL with tool calling; all SQL runs on your computer
- The LLM sees the schema, your context, and the results of summary queries, but not the dashboard’s filtered rows
$df(),$sql(), and$title()are reactive sources that drive ordinary Shiny outputs- A data dictionary gives the LLM the domain knowledge it can’t infer from column names
- Deploy with Posit Publisher, and keep API keys in secret variables
Acknowledgements
- Slides derived in part from posit::conf 2025 - Shiny for R Workshop by Colin Rundel and licensed under a Creative Commons Attribution 4.0 International License.
- {querychat} materials derived in part from Programming with LLMs and licensed under a Creative Commons Attribution 4.0 International (CC BY) License.