library(tidyverse)
library(readxl)
library(janitor)
library(scales)AE 07: Importing and cleaning lottery data
Suggested answers
Application exercise
Answers
Packages
We will use the following four packages in this application exercise.
- tidyverse: For data import, wrangling, and visualization.
- readxl: For importing data from Excel.
- janitor: For cleaning column names.
- scales: For formatting ggplot2 scales.
Powerball
A lottery is form of gambling that involves the drawing of numbers at random for a prize.1 In the United States, Powerball is a popular multi-state lottery played in 45 states, Washington D.C., Puerto Rico, and the US Virgin Islands. 2 The basic rules are (relatively) straightforward :
1 Source: Wikipedia.
2 Source: Powerball.com
- Powerball costs $2 per play.
- Players select five numbers between 1 and 69 for the white balls, then select one number between 1 and 26 for the red Powerball.
- Drawings are held every Monday, Wednesday, and Saturday night.
- The Powerball jackpot grows until it is won. Players win a prize by matching one of the 9 ways to win. The jackpot is won by matching all five white balls in any order and the red Powerball.3
3 For our purposes here, we will only examine the Powerball jackpot results.
4 Drawing history can be obtained from their website.
The Colorado Lottery provides detailed information on Powerball drawings dating back to August 2001.4 For these exercises we will work with a dataset containing every Powerball drawing in the Colorado Lottery’s database.
Import and clean the data
The dataset is available for download as an Excel spreadsheet.
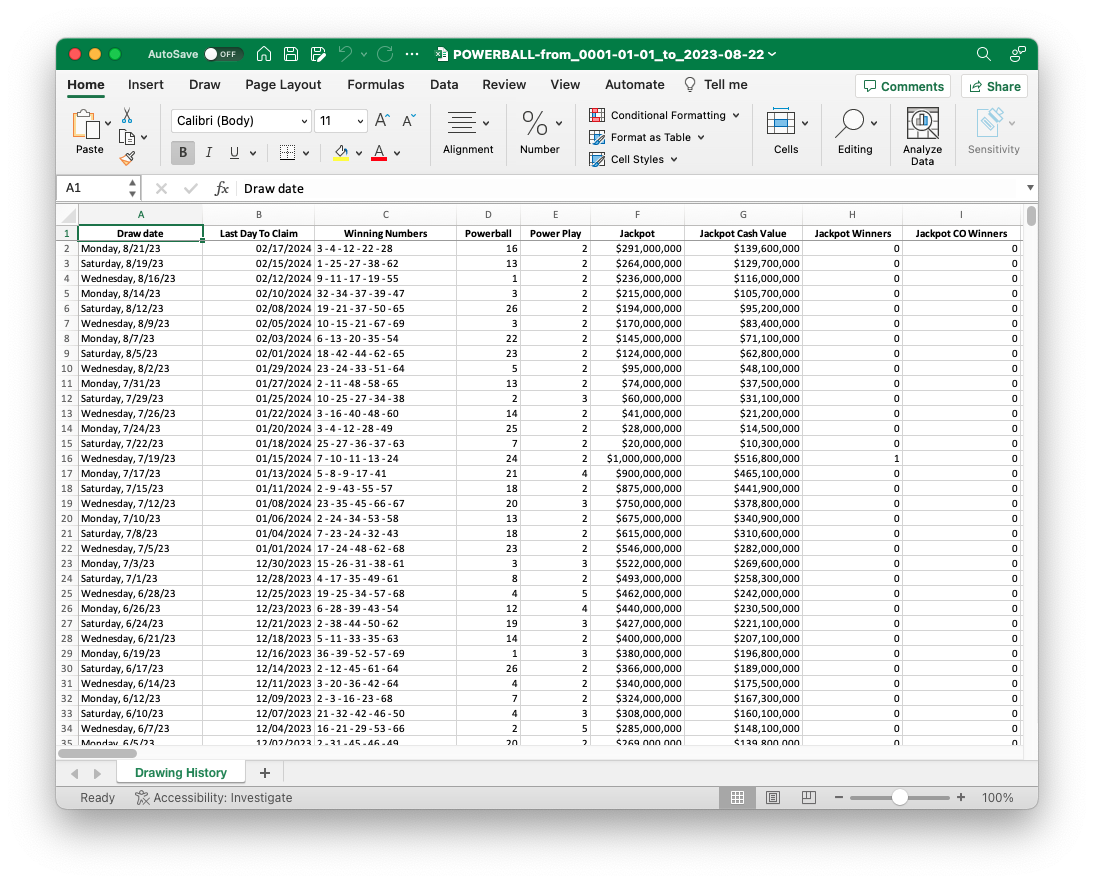
Demo: Import the data file so it looks like below. Store it as powerball_raw.
#> # A tibble: 2,420 × 61
#>    `Draw date`      `Last Day To Claim` `Winning Numbers` Powerball `Power Play`
#>    <chr>            <dttm>              <chr>                 <dbl>        <dbl>
#>  1 Saturday, 9/23/… 2024-03-21 00:00:00 1 - 12 - 20 - 33…        21            2
#>  2 Wednesday, 9/20… 2024-03-18 00:00:00 16 - 27 - 59 - 6…        23            3
#>  3 Monday, 9/18/23  2024-03-16 00:00:00 2 - 21 - 26 - 40…         9            3
#>  4 Saturday, 9/16/… 2024-03-14 00:00:00 8 - 11 - 19 - 24…         5            2
#>  5 Wednesday, 9/13… 2024-03-11 00:00:00 22 - 30 - 37 - 4…        18            3
#>  6 Monday, 9/11/23  2024-03-09 00:00:00 9 - 25 - 27 - 53…         5            2
#>  7 Saturday, 9/9/23 2024-03-07 00:00:00 11 - 19 - 29 - 6…        25            2
#>  8 Wednesday, 9/6/… 2024-03-04 00:00:00 9 - 14 - 20 - 23…         1            3
#>  9 Monday, 9/4/23   2024-03-02 00:00:00 1 - 26 - 32 - 46…        13            3
#> 10 Saturday, 9/2/23 2024-02-29 00:00:00 25 - 38 - 42 - 6…        19            4
#> # ℹ 2,410 more rows
#> # ℹ 56 more variables: Jackpot <dbl>, `Jackpot Cash Value` <dbl>,
#> #   `Jackpot Winners` <dbl>, `Jackpot CO Winners` <dbl>, `Match 5 Prize` <dbl>,
#> #   `Match 5 CO Winners` <dbl>, `Match 5 Prize (with Power Play)` <dbl>,
#> #   `Match 5 CO Winners (with Power Play)` <dbl>,
#> #   `Match 4 + Powerball Prize` <dbl>, `Match 4 + Powerball CO Winners` <dbl>,
#> #   `Match 4 + Powerball Prize (with Power Play)` <dbl>, …
powerball_raw <- read_excel("data/POWERBALL-from_0001-01-01_to_2023-09-25.xlsx",
col_types = c("text", "date", "text",
"numeric", "numeric", "numeric",
"numeric", "numeric", "numeric",
"numeric", "numeric", "numeric",
"numeric", "numeric", "numeric",
"numeric", "numeric", "numeric",
"numeric", "numeric", "numeric",
"numeric", "numeric", "numeric",
"numeric", "numeric", "numeric",
"numeric", "numeric", "numeric",
"numeric", "numeric", "numeric",
"numeric", "numeric", "numeric",
"numeric", "numeric", "numeric",
"numeric", "numeric", "text", "numeric",
"numeric", "numeric", "numeric",
"numeric", "numeric", "numeric",
"numeric", "numeric", "numeric",
"numeric", "numeric", "numeric",
"numeric", "numeric", "numeric",
"numeric", "numeric", "numeric"))
powerball_raw# A tibble: 2,420 × 61
`Draw date` `Last Day To Claim` `Winning Numbers` Powerball `Power Play`
<chr> <dttm> <chr> <dbl> <dbl>
1 Saturday, 9/23/… 2024-03-21 00:00:00 1 - 12 - 20 - 33… 21 2
2 Wednesday, 9/20… 2024-03-18 00:00:00 16 - 27 - 59 - 6… 23 3
3 Monday, 9/18/23 2024-03-16 00:00:00 2 - 21 - 26 - 40… 9 3
4 Saturday, 9/16/… 2024-03-14 00:00:00 8 - 11 - 19 - 24… 5 2
5 Wednesday, 9/13… 2024-03-11 00:00:00 22 - 30 - 37 - 4… 18 3
6 Monday, 9/11/23 2024-03-09 00:00:00 9 - 25 - 27 - 53… 5 2
7 Saturday, 9/9/23 2024-03-07 00:00:00 11 - 19 - 29 - 6… 25 2
8 Wednesday, 9/6/… 2024-03-04 00:00:00 9 - 14 - 20 - 23… 1 3
9 Monday, 9/4/23 2024-03-02 00:00:00 1 - 26 - 32 - 46… 13 3
10 Saturday, 9/2/23 2024-02-29 00:00:00 25 - 38 - 42 - 6… 19 4
# ℹ 2,410 more rows
# ℹ 56 more variables: Jackpot <dbl>, `Jackpot Cash Value` <dbl>,
# `Jackpot Winners` <dbl>, `Jackpot CO Winners` <dbl>, `Match 5 Prize` <dbl>,
# `Match 5 CO Winners` <dbl>, `Match 5 Prize (with Power Play)` <dbl>,
# `Match 5 CO Winners (with Power Play)` <dbl>,
# `Match 4 + Powerball Prize` <dbl>, `Match 4 + Powerball CO Winners` <dbl>,
# `Match 4 + Powerball Prize (with Power Play)` <dbl>, …Your turn: Clean the raw data to fix the following issues:
- Standardize the column names using
snake_caseformat. - Create columns with appropriate data types for the date of the drawing as well as the weekday. Append these columns to the beginning of the data frame.
- Our analysis focuses specifically on jackpot outcomes. Drop columns related to other prizes offered through the Powerball lottery (e.g. Match \(N\), Double Play)
Store the cleaned data frame as powerball.
# standardize column names
powerball <- powerball_raw |>
  clean_names() |>
  # separate draw_date into two variables, clean both
  separate(col = draw_date, into = c(NA, "draw_date"), sep = ",") |>
  mutate(
    draw_date = mdy(draw_date),
    draw_weekday = wday(x = draw_date, label = TRUE),
    .before = last_day_to_claim
  ) |>
  # keep only a smaller subset to work with
  select(draw_date:jackpot_co_winners)
powerball
# A tibble: 2,420 × 10
draw_date draw_weekday last_day_to_claim winning_numbers powerball
<date> <ord> <dttm> <chr> <dbl>
1 2023-09-23 Sat 2024-03-21 00:00:00 1 - 12 - 20 - 33 - 66 21
2 2023-09-20 Wed 2024-03-18 00:00:00 16 - 27 - 59 - 62 - 63 23
3 2023-09-18 Mon 2024-03-16 00:00:00 2 - 21 - 26 - 40 - 42 9
4 2023-09-16 Sat 2024-03-14 00:00:00 8 - 11 - 19 - 24 - 46 5
5 2023-09-13 Wed 2024-03-11 00:00:00 22 - 30 - 37 - 44 - 45 18
6 2023-09-11 Mon 2024-03-09 00:00:00 9 - 25 - 27 - 53 - 66 5
7 2023-09-09 Sat 2024-03-07 00:00:00 11 - 19 - 29 - 63 - 68 25
8 2023-09-06 Wed 2024-03-04 00:00:00 9 - 14 - 20 - 23 - 63 1
9 2023-09-04 Mon 2024-03-02 00:00:00 1 - 26 - 32 - 46 - 51 13
10 2023-09-02 Sat 2024-02-29 00:00:00 25 - 38 - 42 - 66 - 67 19
# ℹ 2,410 more rows
# ℹ 5 more variables: power_play <dbl>, jackpot <dbl>,
# jackpot_cash_value <dbl>, jackpot_winners <dbl>, jackpot_co_winners <dbl>Why does it seem like everyone is winning big?
Anyone living in the United States in the past few years is likely to have seen news reports whenever the jackpot grows dramatically. The 10 biggest lottery jackpots in the United States have all occurred since 2015. What is driving this trend?
How the jackpot value has changed over time
In order to address this question, let’s start first with a simpler question: how has the jackpot value changed over time? The jackpot amount varies for each drawing depending on the number of tickets sold as well as if the jackpot is rolling over from the previous drawing.
Your turn: Create a line graph visualizing the jackpot value for every Powerball drawing over time.
ggplot(data = powerball, mapping = aes(x = draw_date, y = jackpot)) +
  geom_line() +
  scale_y_continuous(labels = label_dollar(scale_cut = cut_short_scale())) +
  theme_minimal() +
  labs(
    x = "Date of lottery drawing",
    y = "Jackpot value",
    title = "Powerball jackpot values have increased dramatically since 2015",
    caption = "Source: Colorado Lottery"
  )
There definitely seems to be an increase in the typical Powerball jackpot values since 2015.
Distribution of winning numbers
To investigate this further, let’s look at the distribution of the white balls + the red Powerball. Presumably since the numbers are drawn at random, then they should be uniformly distributed.
Your turn: Convert winning_numbers into numeric values with one row for each drawing for each number. Keep just two columns: the drawing date and the winning numbers. Store this as powerball_white.
powerball_white <- powerball |>
  separate_longer_delim(
    cols = winning_numbers,
    delim = " - "
  ) |>
  mutate(winning_numbers = parse_number(x = winning_numbers)) |>
  select(draw_date, number = winning_numbers)
powerball_white
# A tibble: 12,100 × 2
draw_date number
<date> <dbl>
1 2023-09-23 1
2 2023-09-23 12
3 2023-09-23 20
4 2023-09-23 33
5 2023-09-23 66
6 2023-09-20 16
7 2023-09-20 27
8 2023-09-20 59
9 2023-09-20 62
10 2023-09-20 63
# ℹ 12,090 more rowsYour turn: Create a similarly structured data frame for the red Powerball called powerball_red. Ensure it has the same column names as powerball_white.
powerball_red <- powerball |>
  select(draw_date, number = powerball)
powerball_red
# A tibble: 2,420 × 2
draw_date number
<date> <dbl>
1 2023-09-23 21
2 2023-09-20 23
3 2023-09-18 9
4 2023-09-16 5
5 2023-09-13 18
6 2023-09-11 5
7 2023-09-09 25
8 2023-09-06 1
9 2023-09-04 13
10 2023-09-02 19
# ℹ 2,410 more rowsYour turn: Combine the two data frames and create a histogram visualizing the distribution of the winning numbers, faceted between the white balls and the Red Powerballs.
bind_rows(
  `White balls` = powerball_white,
  Powerball = powerball_red,
  .id = "num_type"
) |>
  ggplot(mapping = aes(x = number, fill = num_type)) +
  geom_histogram(binwidth = 1) +
  scale_fill_viridis_d(guide = "none") +
  facet_wrap(facets = vars(num_type), scales = "free") +
  theme_minimal() +
  labs(
    x = "Number drawn",
    y = NULL,
    title = "Higher numbers are drawn less frequently",
    subtitle = "Powerball drawings, 2001-23",
    caption = "Source: Colorado Lottery"
  )
Your turn: Visualize the distribution of white balls (numbers drawn) over time using a scatterplot + a smoothing line.
ggplot(data = powerball_white, mapping = aes(x = draw_date, y = number)) +
  geom_point(alpha = 0.06) +
  geom_smooth() +
  theme_minimal() +
  labs(
    x = "Drawing date",
    y = "White balls (numbers drawn)",
    title = "Higher numbers have only been drawn since late 2015",
    subtitle = "Powerball drawings, 2001-23",
    caption = "Source: Colorado Lottery"
  )
`geom_smooth()` using method = 'gam' and formula = 'y ~ s(x, bs = "cs")'
Turns out lottery officials have changed the rules of Powerball over time to change the odds of winning the jackpot. By increasing the pool of choices for the white balls, they double the available combinations of white balls and make it harder to win the jackpot. Higher jackpots spur more casual lottery players to purchase tickets, and overall generate more revenue.
Why wrangle data in R
Question: Why should we bother with writing code to clean our data files (e.g. renaming columns, cleaning variables, separating into new columns/rows) instead of opening the Excel file and editing the data in there to prepare it for a clean import?
Because the code allows us to struggle once and re-use for future datasets and leaves a transparent trail of our modifications while manipulating the data in Excel directly is neither reproducible nor reusable.
Session information
sessioninfo::session_info()─ Session info ───────────────────────────────────────────────────────────────
setting value
version R version 4.3.1 (2023-06-16)
os macOS Ventura 13.5.2
system aarch64, darwin20
ui X11
language (EN)
collate en_US.UTF-8
ctype en_US.UTF-8
tz America/New_York
date 2023-09-27
pandoc 3.1.1 @ /Applications/RStudio.app/Contents/Resources/app/quarto/bin/tools/ (via rmarkdown)
─ Packages ───────────────────────────────────────────────────────────────────
package * version date (UTC) lib source
cellranger 1.1.0 2016-07-27 [1] CRAN (R 4.3.0)
cli 3.6.1 2023-03-23 [1] CRAN (R 4.3.0)
colorspace 2.1-0 2023-01-23 [1] CRAN (R 4.3.0)
digest 0.6.31 2022-12-11 [1] CRAN (R 4.3.0)
dplyr * 1.1.2 2023-04-20 [1] CRAN (R 4.3.0)
evaluate 0.21 2023-05-05 [1] CRAN (R 4.3.0)
fansi 1.0.4 2023-01-22 [1] CRAN (R 4.3.0)
farver 2.1.1 2022-07-06 [1] CRAN (R 4.3.0)
fastmap 1.1.1 2023-02-24 [1] CRAN (R 4.3.0)
forcats * 1.0.0 2023-01-29 [1] CRAN (R 4.3.0)
generics 0.1.3 2022-07-05 [1] CRAN (R 4.3.0)
ggplot2 * 3.4.2 2023-04-03 [1] CRAN (R 4.3.0)
glue 1.6.2 2022-02-24 [1] CRAN (R 4.3.0)
gtable 0.3.3 2023-03-21 [1] CRAN (R 4.3.0)
here 1.0.1 2020-12-13 [1] CRAN (R 4.3.0)
hms 1.1.3 2023-03-21 [1] CRAN (R 4.3.0)
htmltools 0.5.5 2023-03-23 [1] CRAN (R 4.3.0)
htmlwidgets 1.6.2 2023-03-17 [1] CRAN (R 4.3.0)
janitor * 2.2.0 2023-02-02 [1] CRAN (R 4.3.0)
jsonlite 1.8.5 2023-06-05 [1] CRAN (R 4.3.0)
knitr 1.43 2023-05-25 [1] CRAN (R 4.3.0)
labeling 0.4.2 2020-10-20 [1] CRAN (R 4.3.0)
lattice 0.21-8 2023-04-05 [1] CRAN (R 4.3.0)
lifecycle 1.0.3 2022-10-07 [1] CRAN (R 4.3.0)
lubridate * 1.9.2 2023-02-10 [1] CRAN (R 4.3.0)
magrittr 2.0.3 2022-03-30 [1] CRAN (R 4.3.0)
Matrix 1.5-4.1 2023-05-18 [1] CRAN (R 4.3.0)
mgcv 1.8-42 2023-03-02 [1] CRAN (R 4.3.0)
munsell 0.5.0 2018-06-12 [1] CRAN (R 4.3.0)
nlme 3.1-162 2023-01-31 [1] CRAN (R 4.3.0)
pillar 1.9.0 2023-03-22 [1] CRAN (R 4.3.0)
pkgconfig 2.0.3 2019-09-22 [1] CRAN (R 4.3.0)
purrr * 1.0.1 2023-01-10 [1] CRAN (R 4.3.0)
R6 2.5.1 2021-08-19 [1] CRAN (R 4.3.0)
readr * 2.1.4 2023-02-10 [1] CRAN (R 4.3.0)
readxl * 1.4.2 2023-02-09 [1] CRAN (R 4.3.0)
rlang 1.1.1 2023-04-28 [1] CRAN (R 4.3.0)
rmarkdown 2.22 2023-06-01 [1] CRAN (R 4.3.0)
rprojroot 2.0.3 2022-04-02 [1] CRAN (R 4.3.0)
rstudioapi 0.14 2022-08-22 [1] CRAN (R 4.3.0)
scales * 1.2.1 2022-08-20 [1] CRAN (R 4.3.0)
sessioninfo 1.2.2 2021-12-06 [1] CRAN (R 4.3.0)
snakecase 0.11.0 2019-05-25 [1] CRAN (R 4.3.0)
stringi 1.7.12 2023-01-11 [1] CRAN (R 4.3.0)
stringr * 1.5.0 2022-12-02 [1] CRAN (R 4.3.0)
tibble * 3.2.1 2023-03-20 [1] CRAN (R 4.3.0)
tidyr * 1.3.0 2023-01-24 [1] CRAN (R 4.3.0)
tidyselect 1.2.0 2022-10-10 [1] CRAN (R 4.3.0)
tidyverse * 2.0.0 2023-02-22 [1] CRAN (R 4.3.0)
timechange 0.2.0 2023-01-11 [1] CRAN (R 4.3.0)
tzdb 0.4.0 2023-05-12 [1] CRAN (R 4.3.0)
utf8 1.2.3 2023-01-31 [1] CRAN (R 4.3.0)
vctrs 0.6.3 2023-06-14 [1] CRAN (R 4.3.0)
viridisLite 0.4.2 2023-05-02 [1] CRAN (R 4.3.0)
withr 2.5.0 2022-03-03 [1] CRAN (R 4.3.0)
xfun 0.39 2023-04-20 [1] CRAN (R 4.3.0)
yaml 2.3.7 2023-01-23 [1] CRAN (R 4.3.0)
[1] /Library/Frameworks/R.framework/Versions/4.3-arm64/Resources/library
──────────────────────────────────────────────────────────────────────────────