AE 07: Using {duckdb} for Lego® data
Packages
We will use the following packages in this application exercise.
- {tidyverse}: For data import, wrangling, and visualization.
- {duckdb}: To query a DuckDB.
- {dbplyr}: To translate our {dplyr} and {tidyr} functions to SQL.
- {scales}: Formatting graph labels.
Lego®
The Lego® Group was founded in 1932 by Ole Kirk Kristiansen. “LEGO” is an abbreviation of the two Danish words “leg” and “godt”, meaning “play well”. In the 1950s, the Lego® Group launched its most popular line of toys: LEGO Bricks. The company has produced over 600 billion LEGO bricks since its founding, and has become one of the most popular toys in the world. As of 2026, the company has produced over 26,000 different sets and over 60,000 unique parts. Hobbyists and afficianados of the toy have created a vibrant community around collecting and building with LEGO bricks, and there are many online resources for sharing and discussing LEGO-related content.
One of the most popular resources for LEGO fans is Rebrickable, a website that provides a comprehensive database of LEGO sets, parts, and themes. The website allows users to search for specific sets or parts, create and share their own collections, and connect with other LEGO enthusiasts. Rebrickable also provides a variety of tools and resources for building and customizing LEGO creations, making it a valuable resource for both casual fans and serious collectors. They publish a comprehensive dataset of LEGO-related data, which can be accessed through their website or downloaded in bulk. Unfortunately the dataset is difficult to work with in its raw form, as it is provided as a collection of CSV files that are not optimized for analysis. In total there are over 1.7 million rows of data split across 12 tables.
To solve these issues, we will utilize a DuckDB that contains all the tables provided by Rebrickable. This dataset can be access from data/lego.duckdb.
Connect to the database
Demonstration: Connect to the local database and identify the tables.
duckdb is storing downloaded extensions and secrets under ~/.duckdb:
ℹ /Users/bcs88/.duckdb
This persists across sessions and is shared with the DuckDB CLI and other clients.
ℹ Run duckdb(shared_home = FALSE) to use a temporary directory instead.
ℹ See ?duckdb_storage for details and alternatives.dbListTables(con) [1] "colors" "elements" "inventories"
[4] "inventory_minifigs" "inventory_parts" "inventory_sets"
[7] "minifigs" "part_categories" "part_relationships"
[10] "parts" "sets" "themes" The database has the following relational structure:
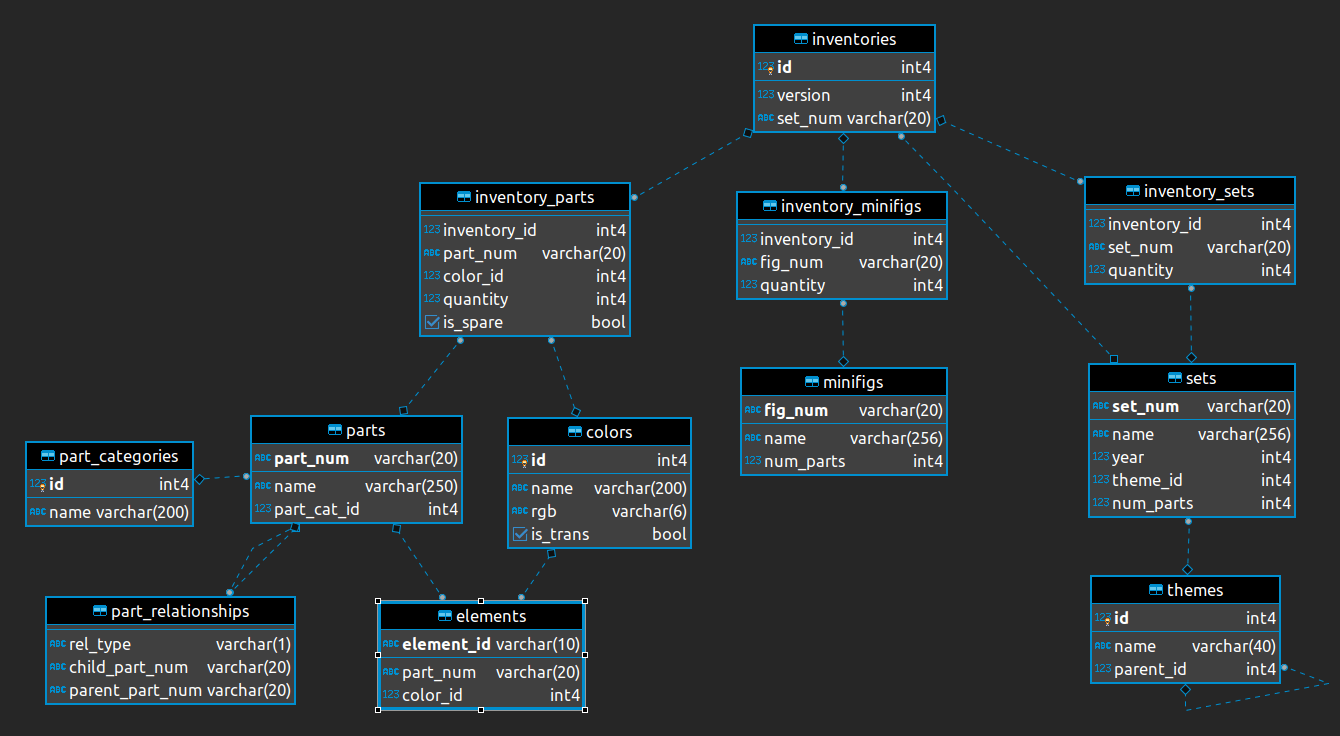
Demonstration: Use tbl() to create an object that represents each database table. This will allow us to use {dbplyr} to translate our code to the corresponding SQL query.
lego_colors <- tbl(con, "colors")
lego_elements <- tbl(con, "elements")
lego_inventories <- tbl(con, "inventories")
lego_inventory_minifigs <- tbl(con, "inventory_minifigs")
lego_inventory_parts <- tbl(con, "inventory_parts")
lego_inventory_sets <- tbl(con, "inventory_sets")
lego_minifigs <- tbl(con, "minifigs")
lego_part_categories <- tbl(con, "part_categories")
lego_part_relationships <- tbl(con, "part_relationships")
lego_parts <- tbl(con, "parts")
lego_sets <- tbl(con, "sets")
lego_themes <- tbl(con, "themes")
Examine the relational structure of the database
Your turn: Identify the primary key for colors. What is its foreign key in the elements and inventory_parts tables?
Add response here.
Your turn: Identify the primary key for themes. What does the dashed line between themes and themes mean?
Add response here.
Translate some basic SQL queries
Your turn: Explain what each of the following SQL queries does, and recreate them using {dbplyr}.
SELECT "sets".*
FROM "sets"
WHERE (num_parts > 200.0)
Add response here.
# add code hereSELECT "year", AVG(num_parts) AS num_parts
FROM "sets"
GROUP BY "year"Add response here.
# add code hereChange over time in set complexity
Now let’s examine how the complexity of LEGO® sets has changed over time. We can use the number of parts in a set as a proxy for its complexity.
Demonstration: Visualize the change over time in the number of parts in sets.
# add code hereVisualize the average set size over time
Your turn: Visualize the change over time in the average number of parts in sets. For each year, calculate the average number of parts in sets released that year, and visualize the change in this value over time.
# add code hereCalculate a rolling average
Demonstration: Calculate a rolling five-year average set size.
# add code hereUse case for SQL: Data-driven dashboards
Even when you are not writing SQL queries by hand, or converting from R code, SQL has a number of useful applications. {querychat} is a package for R or Python that enables natural language exploration of tabular data, using SQL and large language models (LLMs) to generate queries and visualizations. This allows users to ask questions about their data in natural language, and receive answers in the form of SQL queries and visualizations.
Demonstration: Use the Lego Explorer app to explore the Lego® dataset.
- What is the parent theme with the most “children” themes?
- Change over time in set complexity