Quiz 02
Quiz
Overview
Quiz 2 will be held on October 24th in-class. It will be a 50 minute in-person, timed quiz.
The quiz will cover all material through the end of week 8 (rectangling data), with an emphasis on content taught since quiz 01. It will consist of a series of short answer and free response questions. Questions are designed to evaluate your understanding of concepts and methods. You may be asked to answer conceptual questions, interpret visualizations, interpret code and output, and/or write code by hand.
Students with SDS accommodations
Students who have registered SDS accommodations related to timed assignments are implemented by the SDS Alternative Testing Program. You will receive separate instructions from SDS about how to take the quiz with your accommodations. If you have any questions about your accommodations, please contact SDS directly.
Students with religious or other accommodations
If you require an accommodation for quiz 01 on the basis of religious observances, athletics, military service, or another accommodation listed on the course syllabus, please contact us at soltoffbc@cornell.edu by October 21. Any accommodation requests received after this date are unlikely to be approved.
Rules & Notes
Academic Integrity
- A student shall in no way misrepresent his or her work.
- A student shall in no way fraudulently or unfairly advance his or her academic position.
- A student shall refuse to be a party to another student’s failure to maintain academic integrity.
- A student shall not in any other manner violate the principle of academic integrity.
- This is an individual assignment. Everything in the quiz is for your eyes only.
- The quiz will be held in-person. All responses will be written by hand and submitted on paper.
- You may not use any electronic devices during the quiz.1 This includes laptops, tablets, phones, smartwatches, etc.
- You may not use any physical materials during the quiz. This includes textbooks, notes, calculators, etc. Any required information will be provided in the quiz.
Submission
- All responses will be submitted on paper using the provided forms. Quizzes will be evaluated and returned to you via Gradescope.
Grading
- Each quiz is weighted equally. There will be three quizzes in total, so each quiz is worth 5% of your final grade.
Practice problems
NoteInstructions
Below are some practice problems you may complete in order to prepare for the quiz. The suggested solution is hidden below each exercise. Try to solve the problem on your own before looking at the solution.
-
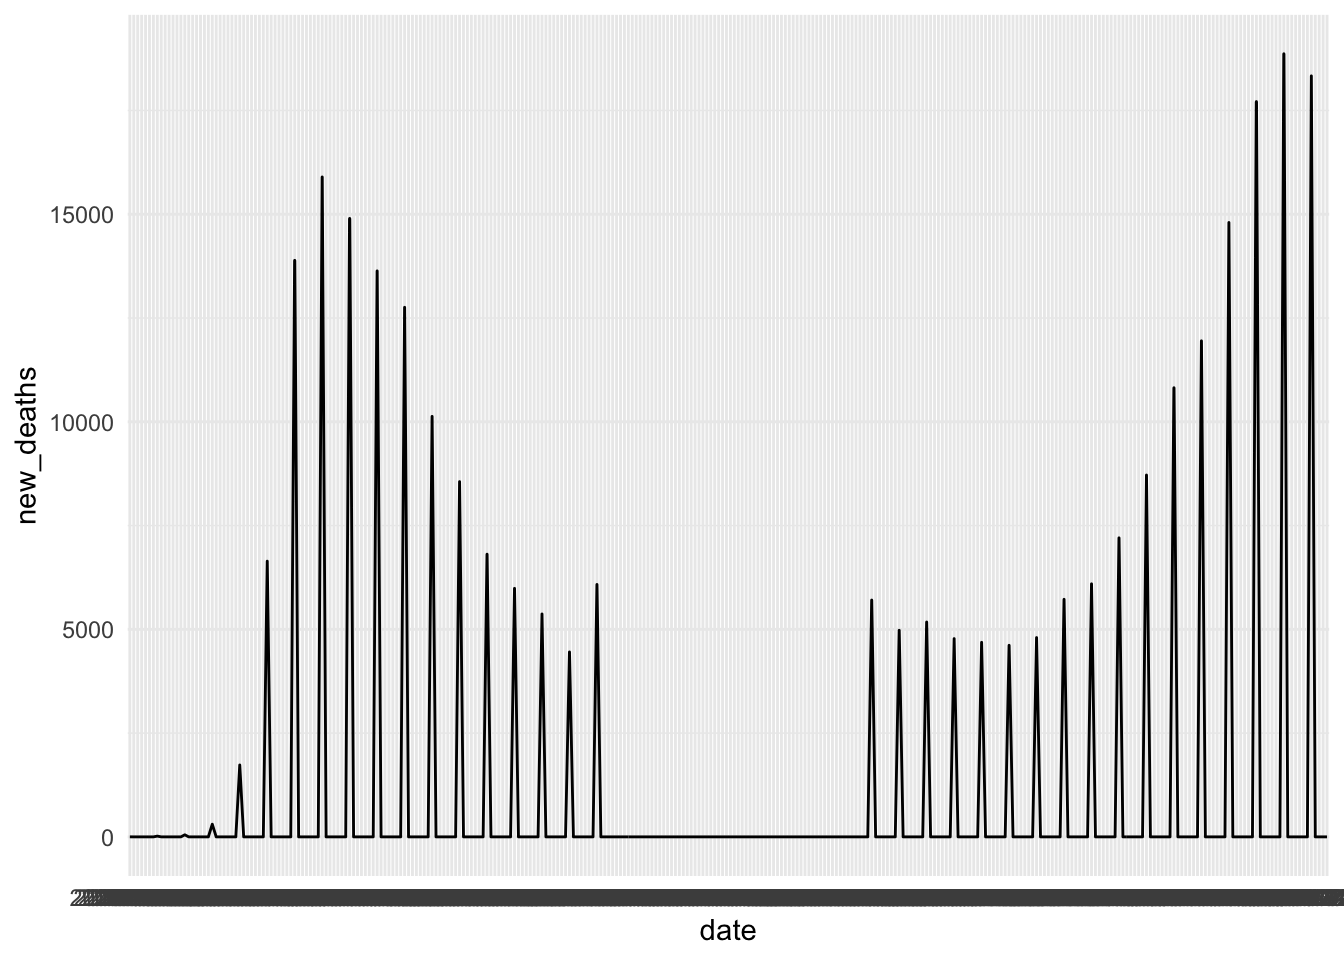
There are a few things wrong with this plot. Pick one, describe what you observe, and make a guess about what might cause it. Propose an idea about how to fix the issue (assume you are correct in your diagnosis).
NoteSuggested solutionPossible answers include:
- If regarding the straight line in the middle of the graph: due to missing values, underlying data needs to be examined to determine why missing values exist (e.g., better values should be imputed).
- If regarding the “date smear” in the x-axis: due to poor formatting of dates horizontally, they all blend together; it could be fixed by structuring the date column as a
dateclass, formatting dates to be shorter, at fewer intervals, and/or rotating dates in the x-axis. - If regarding lack of clarity in the plot: we can fix it by adding axis labels.
-
A student wants to scrape article information from a news website. They’ve written the following code but it’s not working correctly:
library(tidyverse)
library(rvest)

# Read the page
page <- read_html("https://example-news-site.com")

# Extract article titles
titles <- html_elements(x = page, css = ".article-title") |>
  html_text2()

# Extract article dates
dates <- html_elements(x = page, css = ".post-date") |>
  html_text2()

# Extract article URLs
urls <- html_elements(x = page, css = ".read-more") |>
  html_text2()

# Create a tibble
articles <- tibble(
  title = titles,
  date = dates,
  url = urls
)
Identify the error in extracting the article URLs. What function should be used instead and why?
NoteSuggested solutionThe code uses
html_text2()to extract URLs, but it should usehtml_attr(name = "href")instead. Thehtml_text2()function extracts the text content of an element, whilehtml_attr()extracts attribute values from HTML elements. URLs are stored in the href attribute of link elements, not as text content. -
Rate limiting and API etiquette
Explain what “rate limiting” means in the context of APIs. Why do API providers implement rate limits?
A student writes a loop to make 1000 API requests in rapid succession. What problems might this cause, and what is a better approach?
NoteSuggested solution-
Rate limiting restricts how many API requests a user can make within a given time period (e.g., 100 requests per hour, or 10 requests per second). API providers implement rate limits to:
- Prevent server overload and ensure service remains available for all users
- Manage infrastructure costs
- Prevent abuse or malicious activity
- Encourage users to upgrade to paid tiers for higher limits
-
Making 1000 rapid requests could:
- Trigger the API’s rate limit, causing requests to be rejected with errors (often HTTP 429)
- Overload the server, potentially degrading service for other users
- Get the student’s IP address or API key banned
Better approaches:
- Add delays between requests using Sys.sleep()
- Batch requests if the API supports it
- Cache results to avoid repeated requests for the same data
- Check the API documentation for recommended request rates
-
A researcher has two datasets:
students# A tibble: 4 × 2 student_id name <dbl> <chr> 1 101 Alice 2 102 Bob 3 103 Carol 4 104 Dangrades# A tibble: 4 × 3 student_id course grade <dbl> <chr> <dbl> 1 101 Math 85 2 102 Math 92 3 102 English 88 4 105 Math 78If the researcher uses
left_join(students, grades, by = join_by(student_id)), how many rows will the result have? Explain what happens to Carol (student 103) and the student with ID 105.The researcher wants to identify which students are enrolled in at least one course. Which join function (
left_join(),right_join(),inner_join(), orsemi_join()) would be most appropriate and why?
NoteSuggested solution-
The result will have 5 rows:
- Alice (101) appears once with her Math grade
- Bob (102) appears twice - once for Math and once for English (the join creates multiple rows when there are multiple matches)
- Carol (103) appears once with NA values for course and grade (
left_join()keeps all rows from the left table) - Dan (104) appears once with NA values for course and grade
- Student 105 does NOT appear (
left_join()only keeps rows from the left table)
-
Use
semi_join(students, grades, by = join_by(student_id)). This returns only students who have at least one matching record in grades, but:- Keeps only the columns from students (no grade information)
- Returns each student only once (no duplicate rows even if they have multiple grades)
- Filters to students who are enrolled
Alternatively,
inner_join()would work but would duplicate students with multiple courses and include grade columns that weren’t requested.
-
A student writes a function to calculate a rate of frequency. They define the function as:
compute_rate <- function(numerator, denominator) {
  return(numerator / denominator)
}
Their intent if they call it with a single value, it should compute a rate per 1. For example, calling
compute_rate(10)should return 10. Instead this happens:compute_rate(10)Error in compute_rate(10): argument "denominator" is missing, with no default- Explain the error produced by
compute_rate(10). Why does it occur? - Fix the function so that
compute_rate(10)returns 10. - Fix the function so instead it raises a clear warning if the denominator is missing or zero, and returns
NAin that case.
NoteSuggested solutionThe error occurs because the function
compute_raterequires two arguments:numeratoranddenominator. When called with only one argument (compute_rate(10)), R raises an error indicating that the second argument is missing.-
Fixed version with a default
compute_rate <- function(numerator, denominator = 1) {
  numerator / denominator
}

compute_rate(10) # returns 10
[1] 10compute_rate(10, 2) # returns 5[1] 5 -
Defensive version with explicit checks
Warning in compute_rate(10): Denominator is missing or zero; returning NA.[1] NAcompute_rate(10, 0) # raises warning and returns NAWarning in compute_rate(10, 0): Denominator is missing or zero; returning NA.[1] NAcompute_rate(10, 5) # returns 2[1] 2
- Explain the error produced by
Footnotes
Students with certain SDS accommodations are permitted to use a computer.↩︎