library(tidyverse)
library(janitor)
library(scales)AE 08: Data wrangling with rowwise/column-wise operations
Application exercise
Packages
We will use the following packages in this application exercise.
- tidyverse: For data import, wrangling, and visualization.
- janitor: For cleaning column names.
Powerball
Last class we studied Powerball jackpots over time. Today we will continue this journey and focus on Colorado winners in Match \(N\) Powerball play, prizes available to players who match the red Powerball number and anywhere between 0-4 white ball numbers.
Import and clean the data
The dataset is available for download as a CSV file.
Demo: Import the data file. Store it as powerball_raw.
powerball_raw <- read_csv(file = "data/POWERBALL-from_0001-01-01_to_2023-09-25.csv")Rows: 2420 Columns: 61
── Column specification ────────────────────────────────────────────────────────
Delimiter: ","
chr (31): Draw date, Last Day To Claim, Winning Numbers, Jackpot, Jackpot Ca...
dbl (30): Powerball, Power Play, Jackpot Winners, Jackpot CO Winners, Match ...
ℹ Use `spec()` to retrieve the full column specification for this data.
ℹ Specify the column types or set `show_col_types = FALSE` to quiet this message.powerball_raw# A tibble: 2,420 × 61
`Draw date` `Last Day To Claim` `Winning Numbers` Powerball `Power Play`
<chr> <chr> <chr> <dbl> <dbl>
1 Saturday, 9/23/… 03/21/2024 1 - 12 - 20 - 33… 21 2
2 Wednesday, 9/20… 03/18/2024 16 - 27 - 59 - 6… 23 3
3 Monday, 9/18/23 03/16/2024 2 - 21 - 26 - 40… 9 3
4 Saturday, 9/16/… 03/14/2024 8 - 11 - 19 - 24… 5 2
5 Wednesday, 9/13… 03/11/2024 22 - 30 - 37 - 4… 18 3
6 Monday, 9/11/23 03/09/2024 9 - 25 - 27 - 53… 5 2
7 Saturday, 9/9/23 03/07/2024 11 - 19 - 29 - 6… 25 2
8 Wednesday, 9/6/… 03/04/2024 9 - 14 - 20 - 23… 1 3
9 Monday, 9/4/23 03/02/2024 1 - 26 - 32 - 46… 13 3
10 Saturday, 9/2/23 02/29/2024 25 - 38 - 42 - 6… 19 4
# ℹ 2,410 more rows
# ℹ 56 more variables: Jackpot <chr>, `Jackpot Cash Value` <chr>,
# `Jackpot Winners` <dbl>, `Jackpot CO Winners` <dbl>, `Match 5 Prize` <chr>,
# `Match 5 CO Winners` <dbl>, `Match 5 Prize (with Power Play)` <chr>,
# `Match 5 CO Winners (with Power Play)` <dbl>,
# `Match 4 + Powerball Prize` <chr>, `Match 4 + Powerball CO Winners` <dbl>,
# `Match 4 + Powerball Prize (with Power Play)` <chr>, …Your turn: Clean the raw data to fix the following issues:
- Standardize the column names using
snake_caseformat. - Create columns with appropriate data types for any date variables date of the drawing as well as the weekday. Append these columns to the beginning of the data frame.
- Fix all of the currency columns to be formatted as numeric types.
Store the cleaned data frame as powerball.
powerball <- powerball_raw |>
  # standardize column names
  clean_names() |>
  # separate draw_date into two variables, clean both
  separate(col = draw_date, into = c(NA, "draw_date"), sep = ",") |>
  mutate(
    draw_date = mdy(draw_date),
    draw_weekday = wday(x = draw_date, label = TRUE),
    last_day_to_claim = mdy(last_day_to_claim),
    .before = last_day_to_claim
  ) |>
  # convert all currency columns to numeric type
  ...
Error: The pipe operator requires a function call as RHS (<text>:13:3)Analyze the data
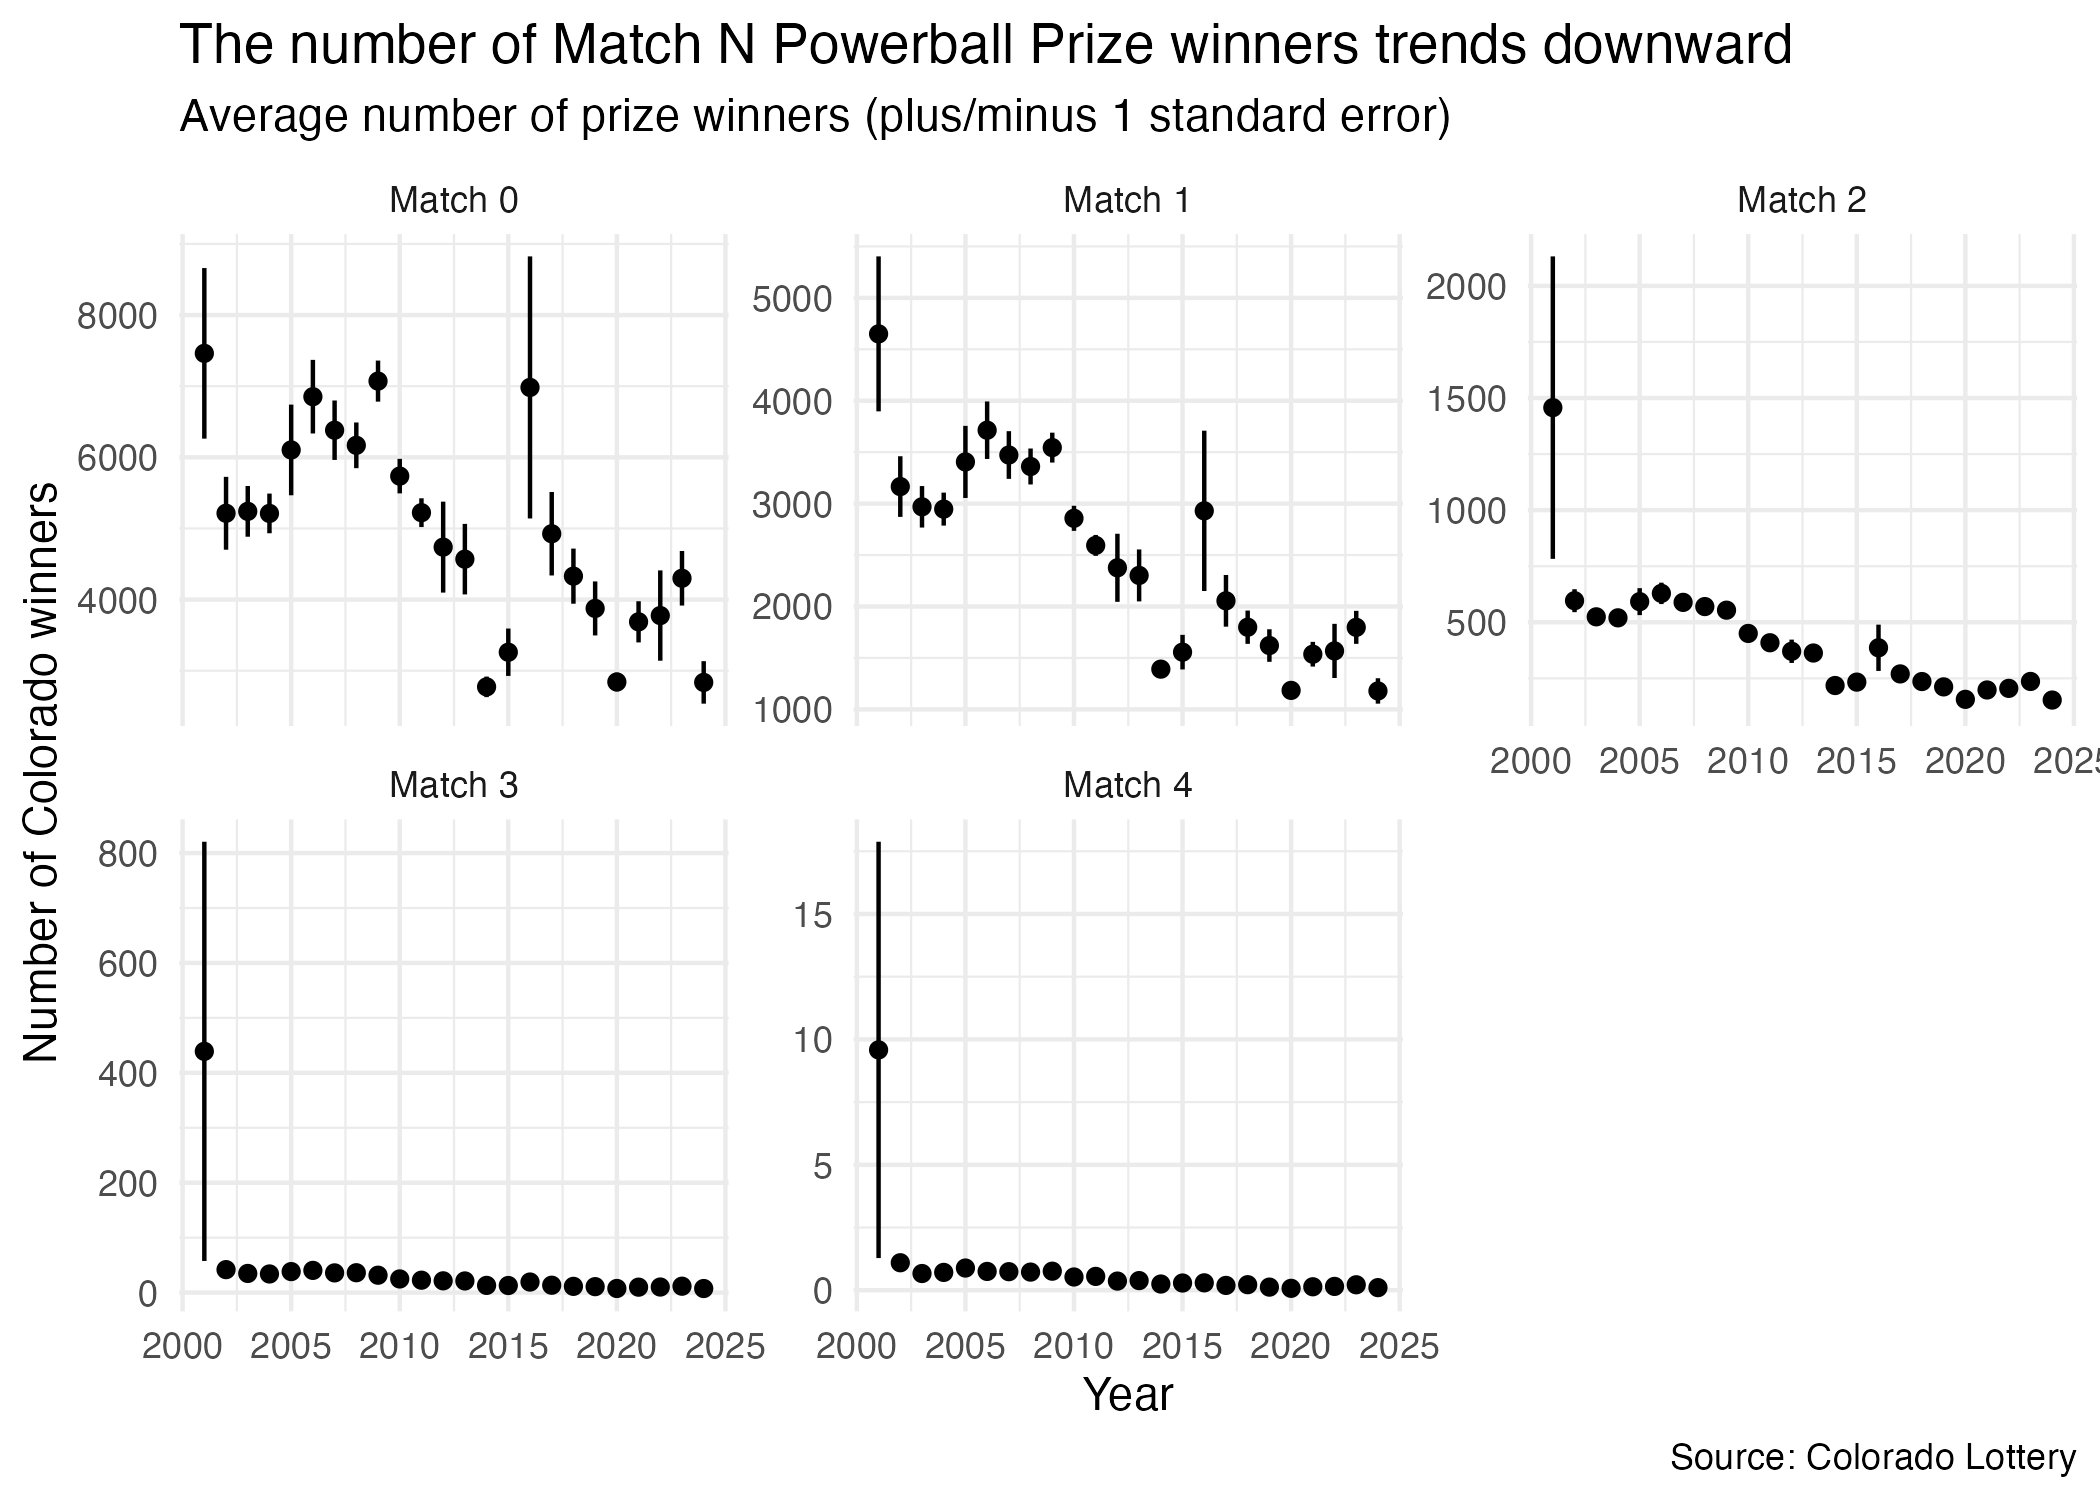
Our goal is to reproduce the following visualization:
In order to accomplish this, we have a few challenges ahead. We will need to:
- Determine the year for every drawing
- Calculate the mean and standard error of the number of winners for each Match \(N\) + Powerball prize for every year
- Structure the data frame so we have one row for each year and prize, and separate columns for the means and standard errors
Generate the year variable
Your turn: Generate a year variable from the draw_date column.
# add code hereCalculate means and standard errors
Your turn: Calculate the mean and standard error for each of the Match \(N\) + Powerball prizes for each year. Your data frame should look something like this:
# A tibble: 23 × 11
year match_4_powerball_co_winners_m…¹ match_4_powerball_co…² match_3_powerball_co…³ match_3_powerball_co…⁴ match_2_powerball_co…⁵
<dbl> <dbl> <dbl> <dbl> <dbl> <dbl>
1 2023 0.193 0.0496 9.75 1.08 198.
2 2022 0.153 0.0363 10.1 1.66 205.
3 2021 0.138 0.0312 9.88 0.804 198.
4 2020 0.0762 0.0260 7.49 0.481 156.
5 2019 0.125 0.0326 10.8 1.18 212.
6 2018 0.221 0.0510 11.3 1.04 236.
7 2017 0.192 0.0412 13.4 1.89 270.
8 2016 0.295 0.103 19.2 5.47 386.
9 2015 0.288 0.0839 12.9 1.55 233.
10 2014 0.248 0.0484 13.1 0.764 218.
# ℹ 13 more rows
# ℹ abbreviated names: ¹match_4_powerball_co_winners_mean, ²match_4_powerball_co_winners_se, ³match_3_powerball_co_winners_mean,
# ⁴match_3_powerball_co_winners_se, ⁵match_2_powerball_co_winners_mean
# ℹ 5 more variables: match_2_powerball_co_winners_se <dbl>, match_1_powerball_co_winners_mean <dbl>,
# match_1_powerball_co_winners_se <dbl>, match_0_powerball_co_winners_mean <dbl>, match_0_powerball_co_winners_se <dbl>
# ℹ Use `print(n = ...)` to see more rows
Tip
Recall the formula for the standard error of a sample mean is:
\[ \begin{aligned} \text{s.e.} &= \sqrt{\frac{\text{Variance}(X)}{\text{Sample size}}} \\ &= \frac{\text{Standard deviation}(X)}{\sqrt{\text{Sample size}}} \end{aligned} \]
# add code hereClean up column names
Your turn: Remove "powerball_co_winners_" from each column name.
Tip
rename() does not allow use of the across() function. Instead, check out rename_with() from the dplyr package.
Tip
stringr contains many functions for working with character strings. Check out the cheat sheet for examples!
# add code hereRestructure data frame to appropriate form for visualization
Demo: We need the structure to be one row for each year and prize (i.e. 0, 1, 2, 3, 4) and separate columns for the means and standard errors. We can use pivot_longer() to accomplish this task, but it’s a bit more complicated than past pivoting operations since the column names contain both a variable (e.g. match_4) and a variable name (i.e. mean or se).
# add code herePlot the data
Demo: Now that we have the appropriate data structure, we can create the visualization.
... |>
  ggplot(mapping = aes(x = year, y = mean)) +
  geom_point() +
  geom_linerange(mapping = aes(
    ymin = mean - se,
    ymax = mean + se
  )) +
  facet_wrap(facets = vars(game), scales = "free_y") +
  labs(
    title = "The number of Match N Powerball Prize winners trends downward",
    subtitle = "Average number of prize winners (plus/minus 1 standard error)",
    x = "Year",
    y = "Number of Colorado winners",
    caption = "Source: Colorado Lottery"
  ) +
  theme_minimal()
Error in eval(expr, envir, enclos): '...' used in an incorrect context